Biological Time Series - Water quality
3.5
Time series of harmful algal blooms in New South Wales
Contributors
Hazel Farrell1
Penelope Ajani2
Shauna Murray2
Phil Baker1
Grant Webster1
Steve Brett3
Anthony Zammit1
Abanti Barua1,4
David Hill3
1 New South Wales Food Authority, New South Wales Department of Primary Industries, Biosecurity and Food Safety, Newington, NSW, Australia
2 Climate Change Cluster (C3), University of Technology Sydney, Sydney, NSW, Australia
3 Microalgal Services, Ormond, Vic, Australia
4 Noakhali Science and Technology University, Noakhali, Bangladesh
Key Information
Time-series of harmful algal blooms in New South Wales are important to manage the potential risks to human health as well as both domestic and export shellfish markets. We present two harmful bloom case studies, Dinophysis at South Ballina Beach and Alexandrium pacificum in Twofold Bay, to highlight the fluctuating and seasonal nature of harmful blooms along this coastline. There is an ongoing need for a more comprehensive understanding of the triggers of these events to safeguard the industry and consumers alike.
Keywords
Dinophysis, Alexandrium pacificum, shellfish food safety monitoring, diarrhetic shellfish toxins, paralytic shellfish toxins
Time series of harmful algal blooms in New South Wales
Bivalve shellfish sold for human consumption in New South Wales (NSW) are sourced from wild or cultured (farmed) shellfish stocks. The high quality of freshly harvested shellfish is largely due to the healthy, productive coastal waters of NSW that supply phytoplankton, the main diet of filter-feeding oysters, mussels, cockles and pipis (‘clams’). Some phytoplankton species produce biotoxins, which can bioaccumulate in shellfish and potentially threaten public health if contaminated shellfish are consumed. Monitoring programs for biotoxins routinely sample both water from shellfish growing areas and shellfish meat to manage potential risks from harmful algal blooms (HABs) to both domestic and export markets. Here we present two case studies – one for Dinophysis and the other for Alexandrium – to highlight the value of time series of harmful algal blooms.
In NSW, routine monitoring of commercial shellfish harvest (aquaculture for oysters and mussels) and wild harvest shellfish collection (pipis and cockles) are conducted in accordance with the NSW Food Authority Biotoxin Management Plan (NSW Food Authority, 2015) and the Australian Shellfish Quality Assurance Program (ASQAP) Manual (ASQAAC, 2016). If the phytoplankton action levels specified in the Biotoxin Management Plan for potentially harmful species were exceeded (e.g., >500 cells/L Dinophysis spp. or >200 cells L-1 for Alexandrium pacificum) then shellfish samples were collected for biotoxin analyses (see Farrell et al. 2018) for a more detailed description of sampling and biotoxin analysis).
Here we present two case studies of the value of time series monitoring for HABs in the context of shellfish harvesting. The first case study is from South Ballina Beach. Pipis (Plebidonax deltoides) are mainly collected from open ocean beaches on the mid-north and north coast beaches of NSW, including South Ballina beach. Here water samples for phytoplankton identification were collected weekly during the pipi harvest season from 1998-2003 (identified to species level) and 2012-2018 (to genus level). Samples were not collected between 2004 and 2011, as there was no commercial wild harvest. From 2012-2018, monitoring focused on June-December each year. Initially sampling consisted of a 1 L water sample, with an accompanying algal net tow sample. In 2012, the method changed to a 50 L water sample filtered with a 20 µm mesh phytoplankton net. Samples were collected and preserved with Lugol’s iodine by fishers at various locations along South Ballina Beach, depending on where pipi stocks were available.
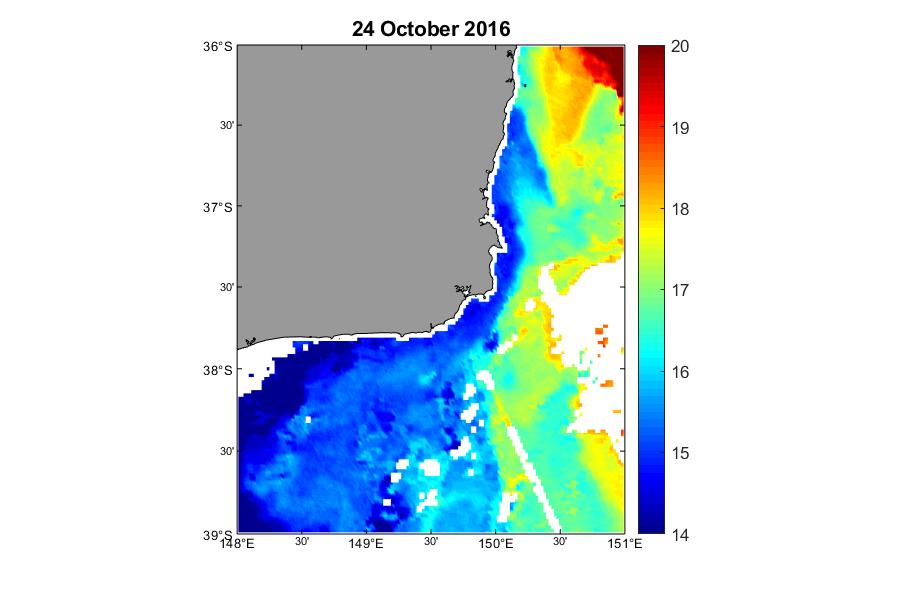
The second case study is from Twofold Bay, NSW. Here water samples comprising 500 – 1000 ml grab samples and a 20 µm mesh phytoplankton net surface drag sample were collected fortnightly and preserved with Lugol’s iodine by trained industry samplers. In the laboratory, these samples were concentrated by gravity-assisted membrane filtration (5 µm) prior to microscopic analysis to species. Simultaneous phytoplankton net haul samples were used to assist with species identification. For the purpose of this case study, three day mean sea surface temperature (SST) and average sea surface temperature anomaly data for Twofold Bay was obtained for 24 October 2016 courtesy of Charitha Pattiaratchi, Integrated Marine Observing System (IMOS) Ocean Glider Facility.
This case study focuses on the dinoflagellate genus Dinophysis, which is a concern for shellfish food safety monitoring programs, as certain species produce diarrhetic shellfish toxins (DSTs: okadaic acid and dinophysistoxins). These toxins may cause gastrointestinal symptoms if contaminated shellfish are consumed. Acute cases generally subside within a few days. Some DST compounds, in laboratory studies on rodents, can cause tumours, but the effects of chronic exposure to DSTs is not well known. In NSW estuaries, long-term phytoplankton and biotoxin monitoring since 2005 have demonstrated a low incidence of Dinophysis spp. and DSTs in shellfish aquaculture areas (Farrell et al., 2018; Farrell et al., 2015; NSW Food Authority, 2017). However, reports of DSTs from Dinophysis spp. in wild harvest pipis collected from open beaches in NSW are more frequent (Farrell et al., 2018; Farrell et al., 2015). Monitoring data from South Ballina Beach on the northern coast of NSW have demonstrated a history of toxic Dinophysis blooms.
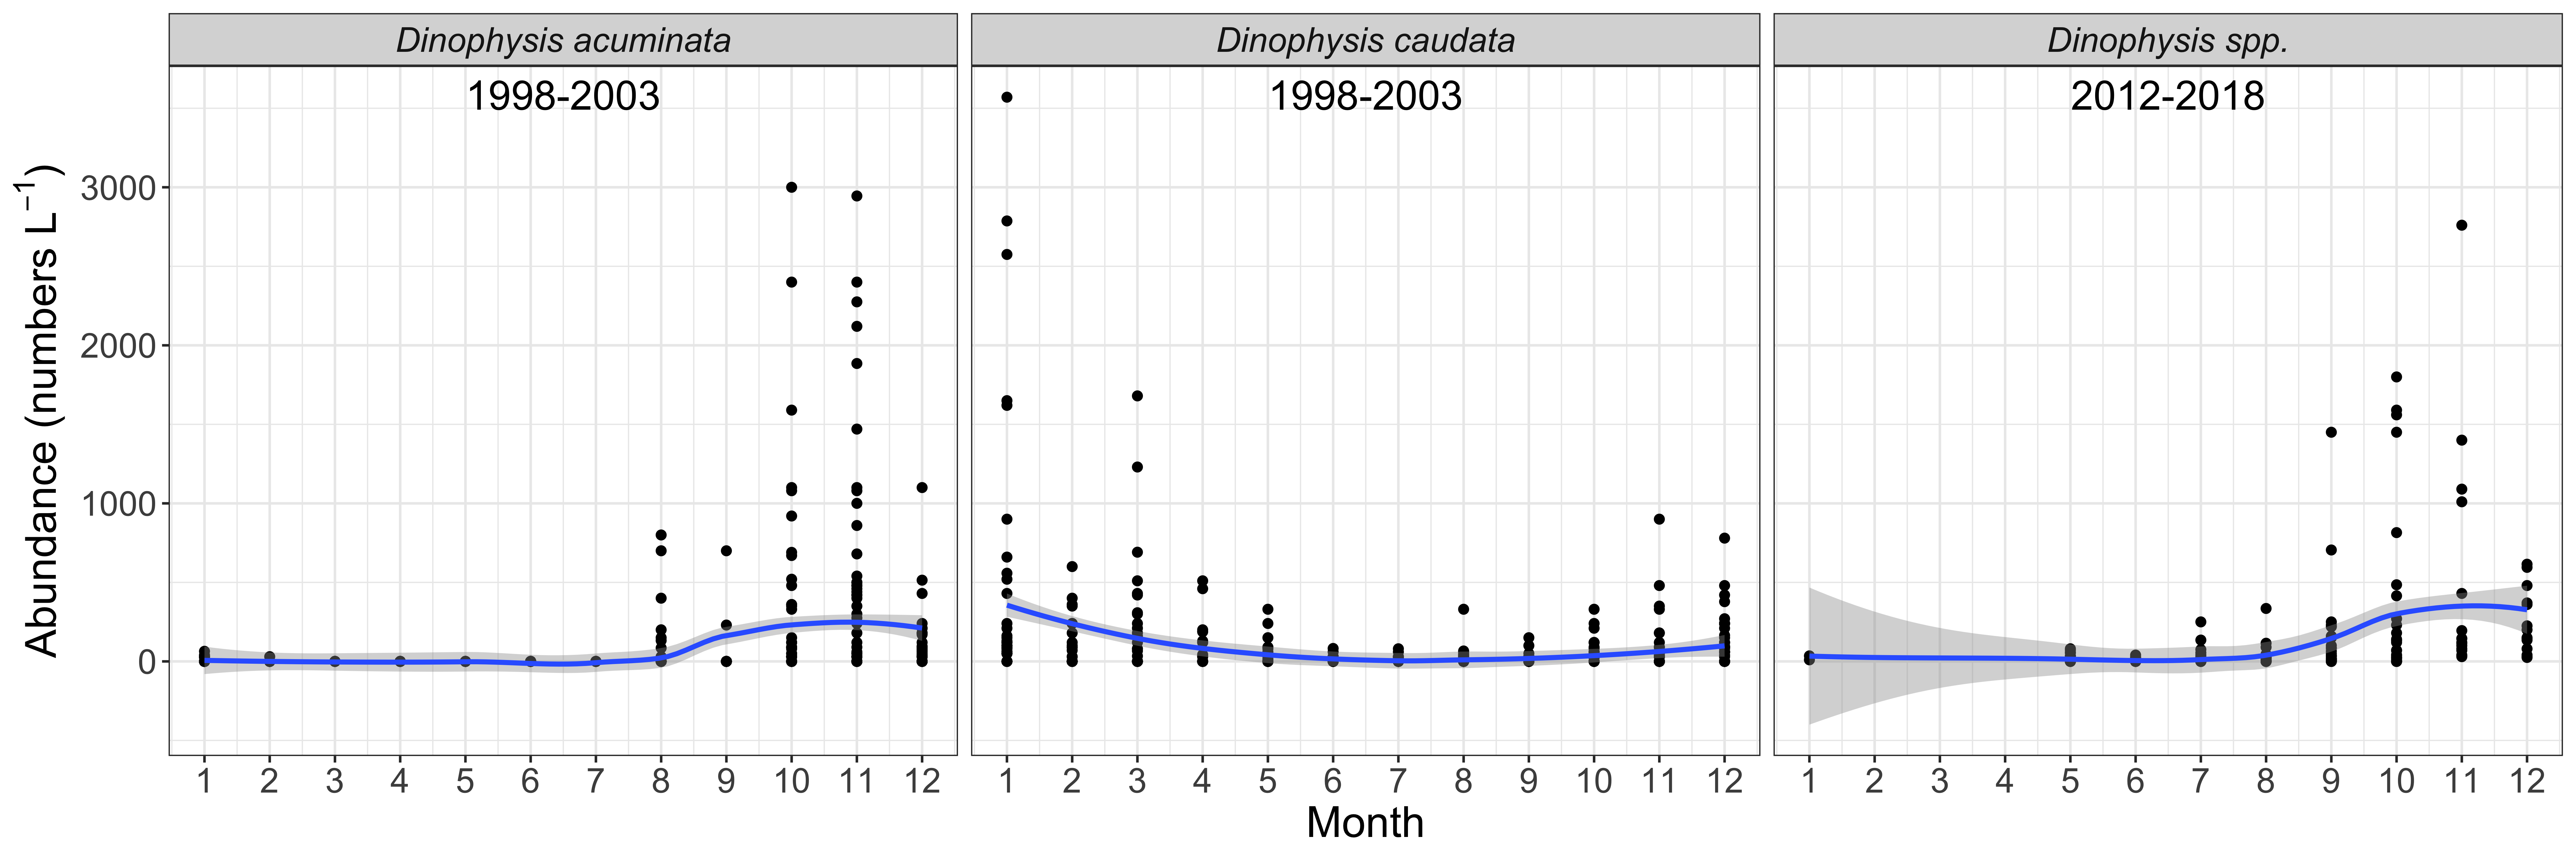
Total Dinophysis abundances across the two sampling periods on South Ballina Beach show concentrations up to 3,560 cells L-1 (Figure 1). Two distinct seasonal patterns were observed. Dinophysis acuminata and Dinophysis caudata, both known to produce DSTs, were reported from routine phytoplankton monitoring at South Ballina Beach between 1998 and 2003 (Figure 2). Peak abundances of D. acuminata (up to 3,000 cells L-1) were observed between August and December (spring-summer), and peak abundances of D. caudata (up to 3,560 cells L-1) were observed between December and March (summer-autumn). A similar seasonal pattern has been reported for these species in NSW oyster producing estuaries (Ajani et al., 2013; Ajani et al., 2016; Farrell et al., 2018). It should be noted that when D. caudata has been documented from toxic events in other locations it generally co-occurs with other toxic Dinophysis species (Reguera et al., 2012). While species level data were unavailable between 2012 and 2018, peak Dinophysis abundances were up to 2,760 cells L-1 between September-December (Figure 2). It is likely that D. acuminata was the main species present during these months based on its seasonal pattern between 1998 and 2003, and observations of Dinophysis species in NSW oyster producing estuaries at the same time (Ajani et al., 2013; Ajani et al., 2016; Farrell et al., 2018).
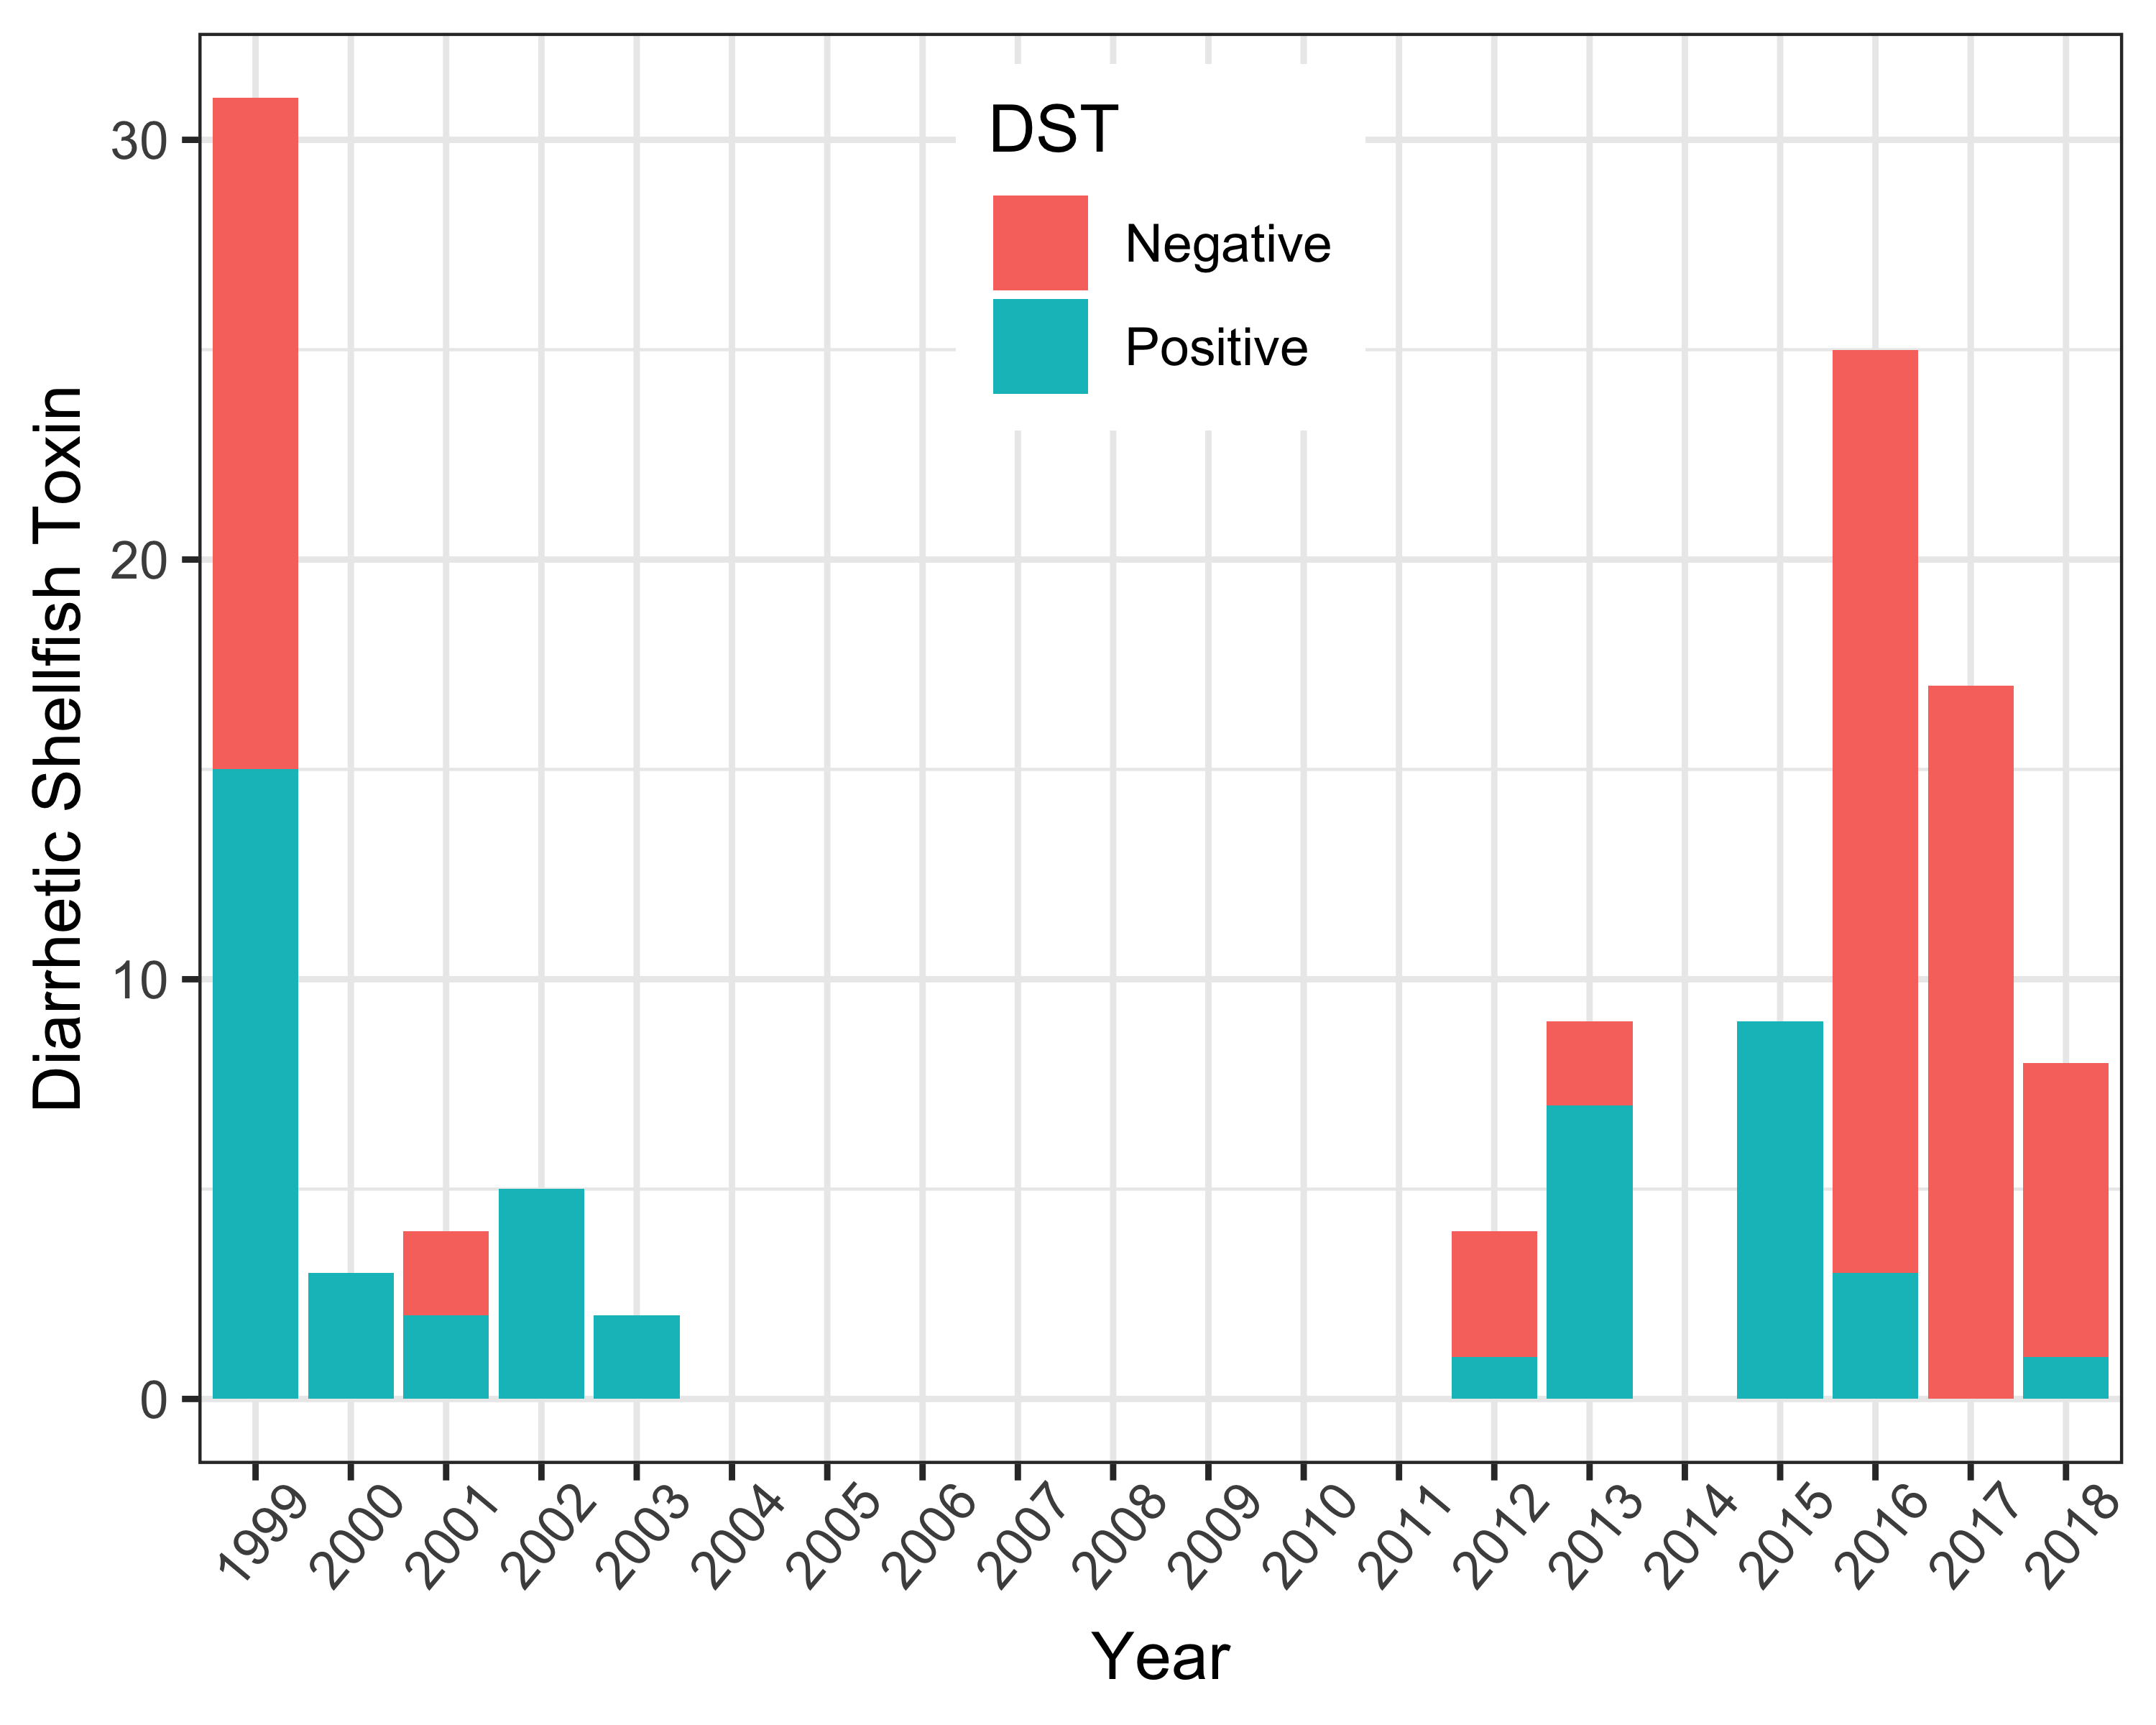
As biotoxin testing was primarily targeted when Dinophysis spp. exceeded action levels, the dataset returned a high percentage (41% of 117 samples) of positive results (Figure 3). In addition, pipis tend to have a slower natural depuration process for algal toxins in comparison to other shellfish (MacKenzie et al., 2002). Positive DST results were ≥50% each year between 1999 and 2003 (Figure 3). During 2012 and 2013, 25 and 78% of samples were positive, respectively. Biotoxin samples were not collected during 2014, as pipi collection on South Ballina Beach ceased following detection of elevated Dinophysis results. Data collected between 2015-2018 included samples collected directly from South Ballina Beach and from a shellfish end-product market survey (Farrell et al., 2018).
Except for 2017, positive results were reported each year. Where quantitative data were available, maximum biotoxin concentrations were reported during October 2013: 0.4 mg kg-1 okadaic acid (regulatory limit = 0.2 mg kg-1) (Farrell et al., 2015).
Although these data reflect the fluctuating and seasonal nature of the wild harvest beach fishery, they also highlight the seasonal and episodic nature of Dinophysis blooms on NSW beaches. Further investigation is required to confirm that D. acuminata is the main source of DSTs in pipis in wild harvest shellfish and to establish the origin of the blooms and transport mechanisms for Dinophysis spp. along the coast of NSW.
Twofold Bay is an open oceanic embayment on the south coast of New South Wales and supports a significant Blue Mussel industry. Alexandrium spp. accounts for >50% of all algal-related aquaculture harvest area closures in NSW (Farrell et al., 2013). This genus is included in the routine monitoring program for NSW shellfish production areas (Ajani et al., 2013; Farrell et al., 2013) to manage the potential risks of paralytic shellfish toxins (PSTs) for shellfish consumers. PSTs are another group of phycotoxins that can result in tingling of the lips, tongue, fingers and toes, muscular weakness and breathing difficulty (Ajani et al., 2017; Deeds et al., 2008). Death can occur due to respiratory failure in extreme cases (Deeds et al., 2008).
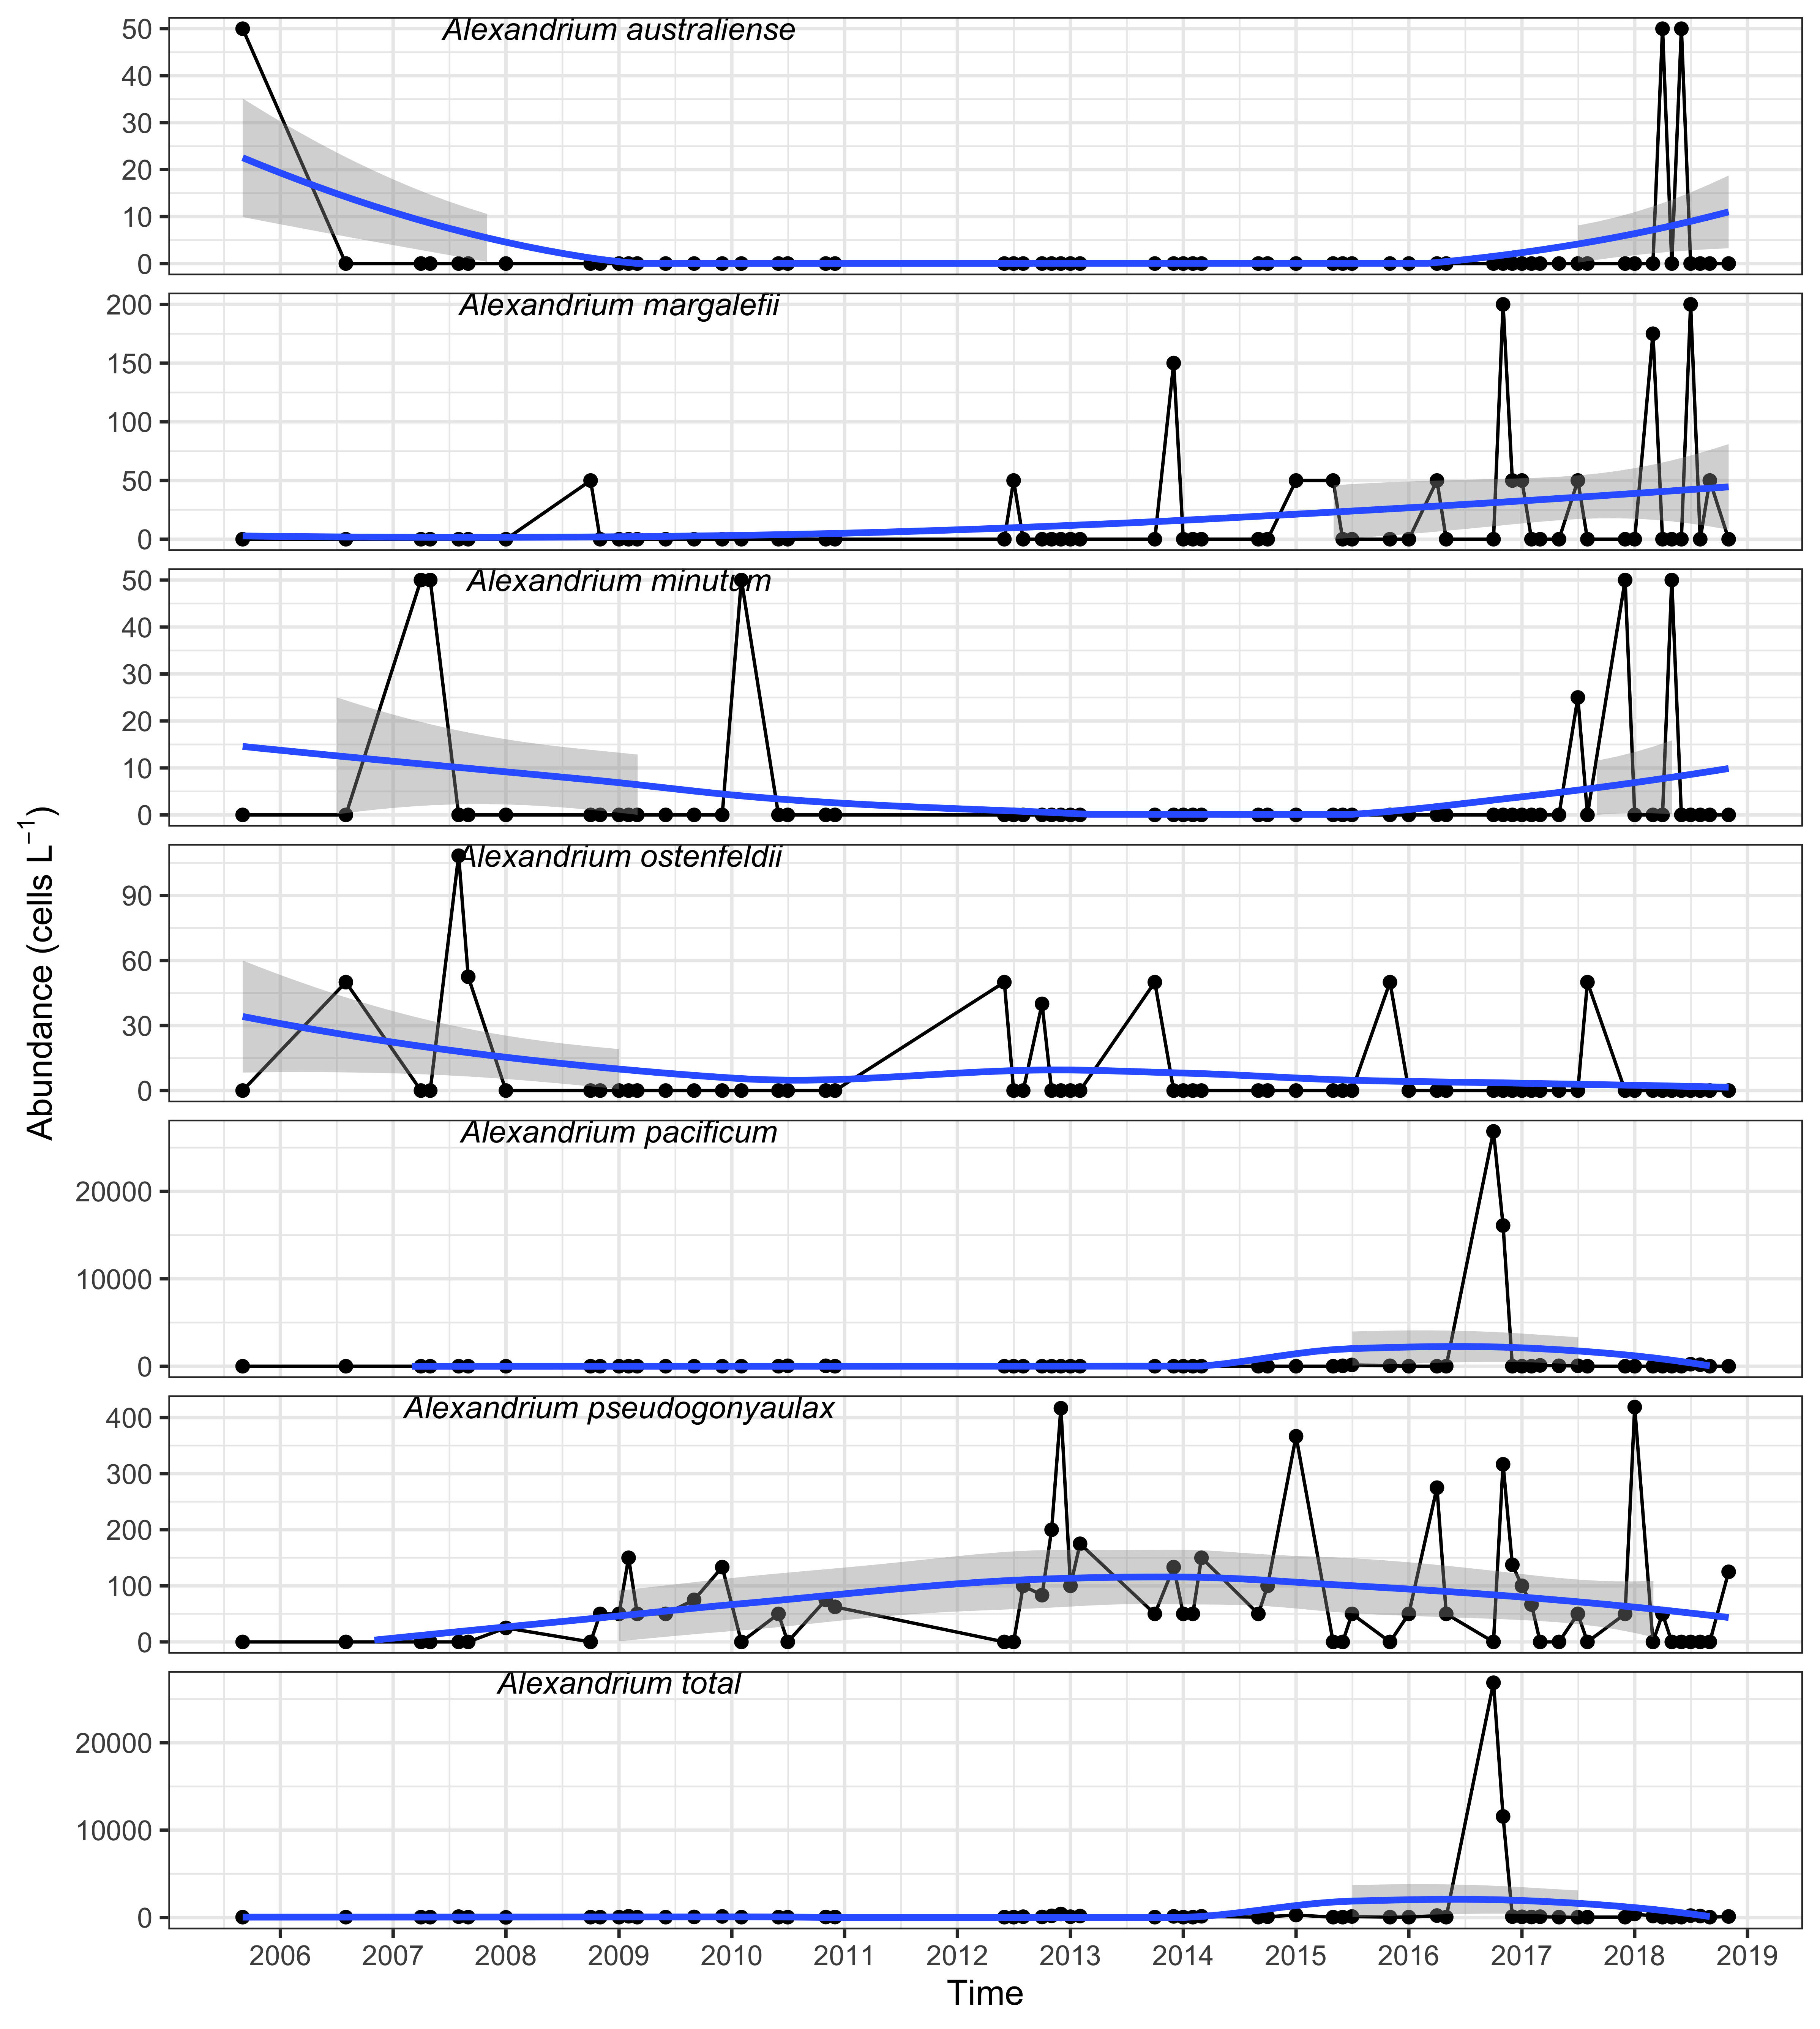
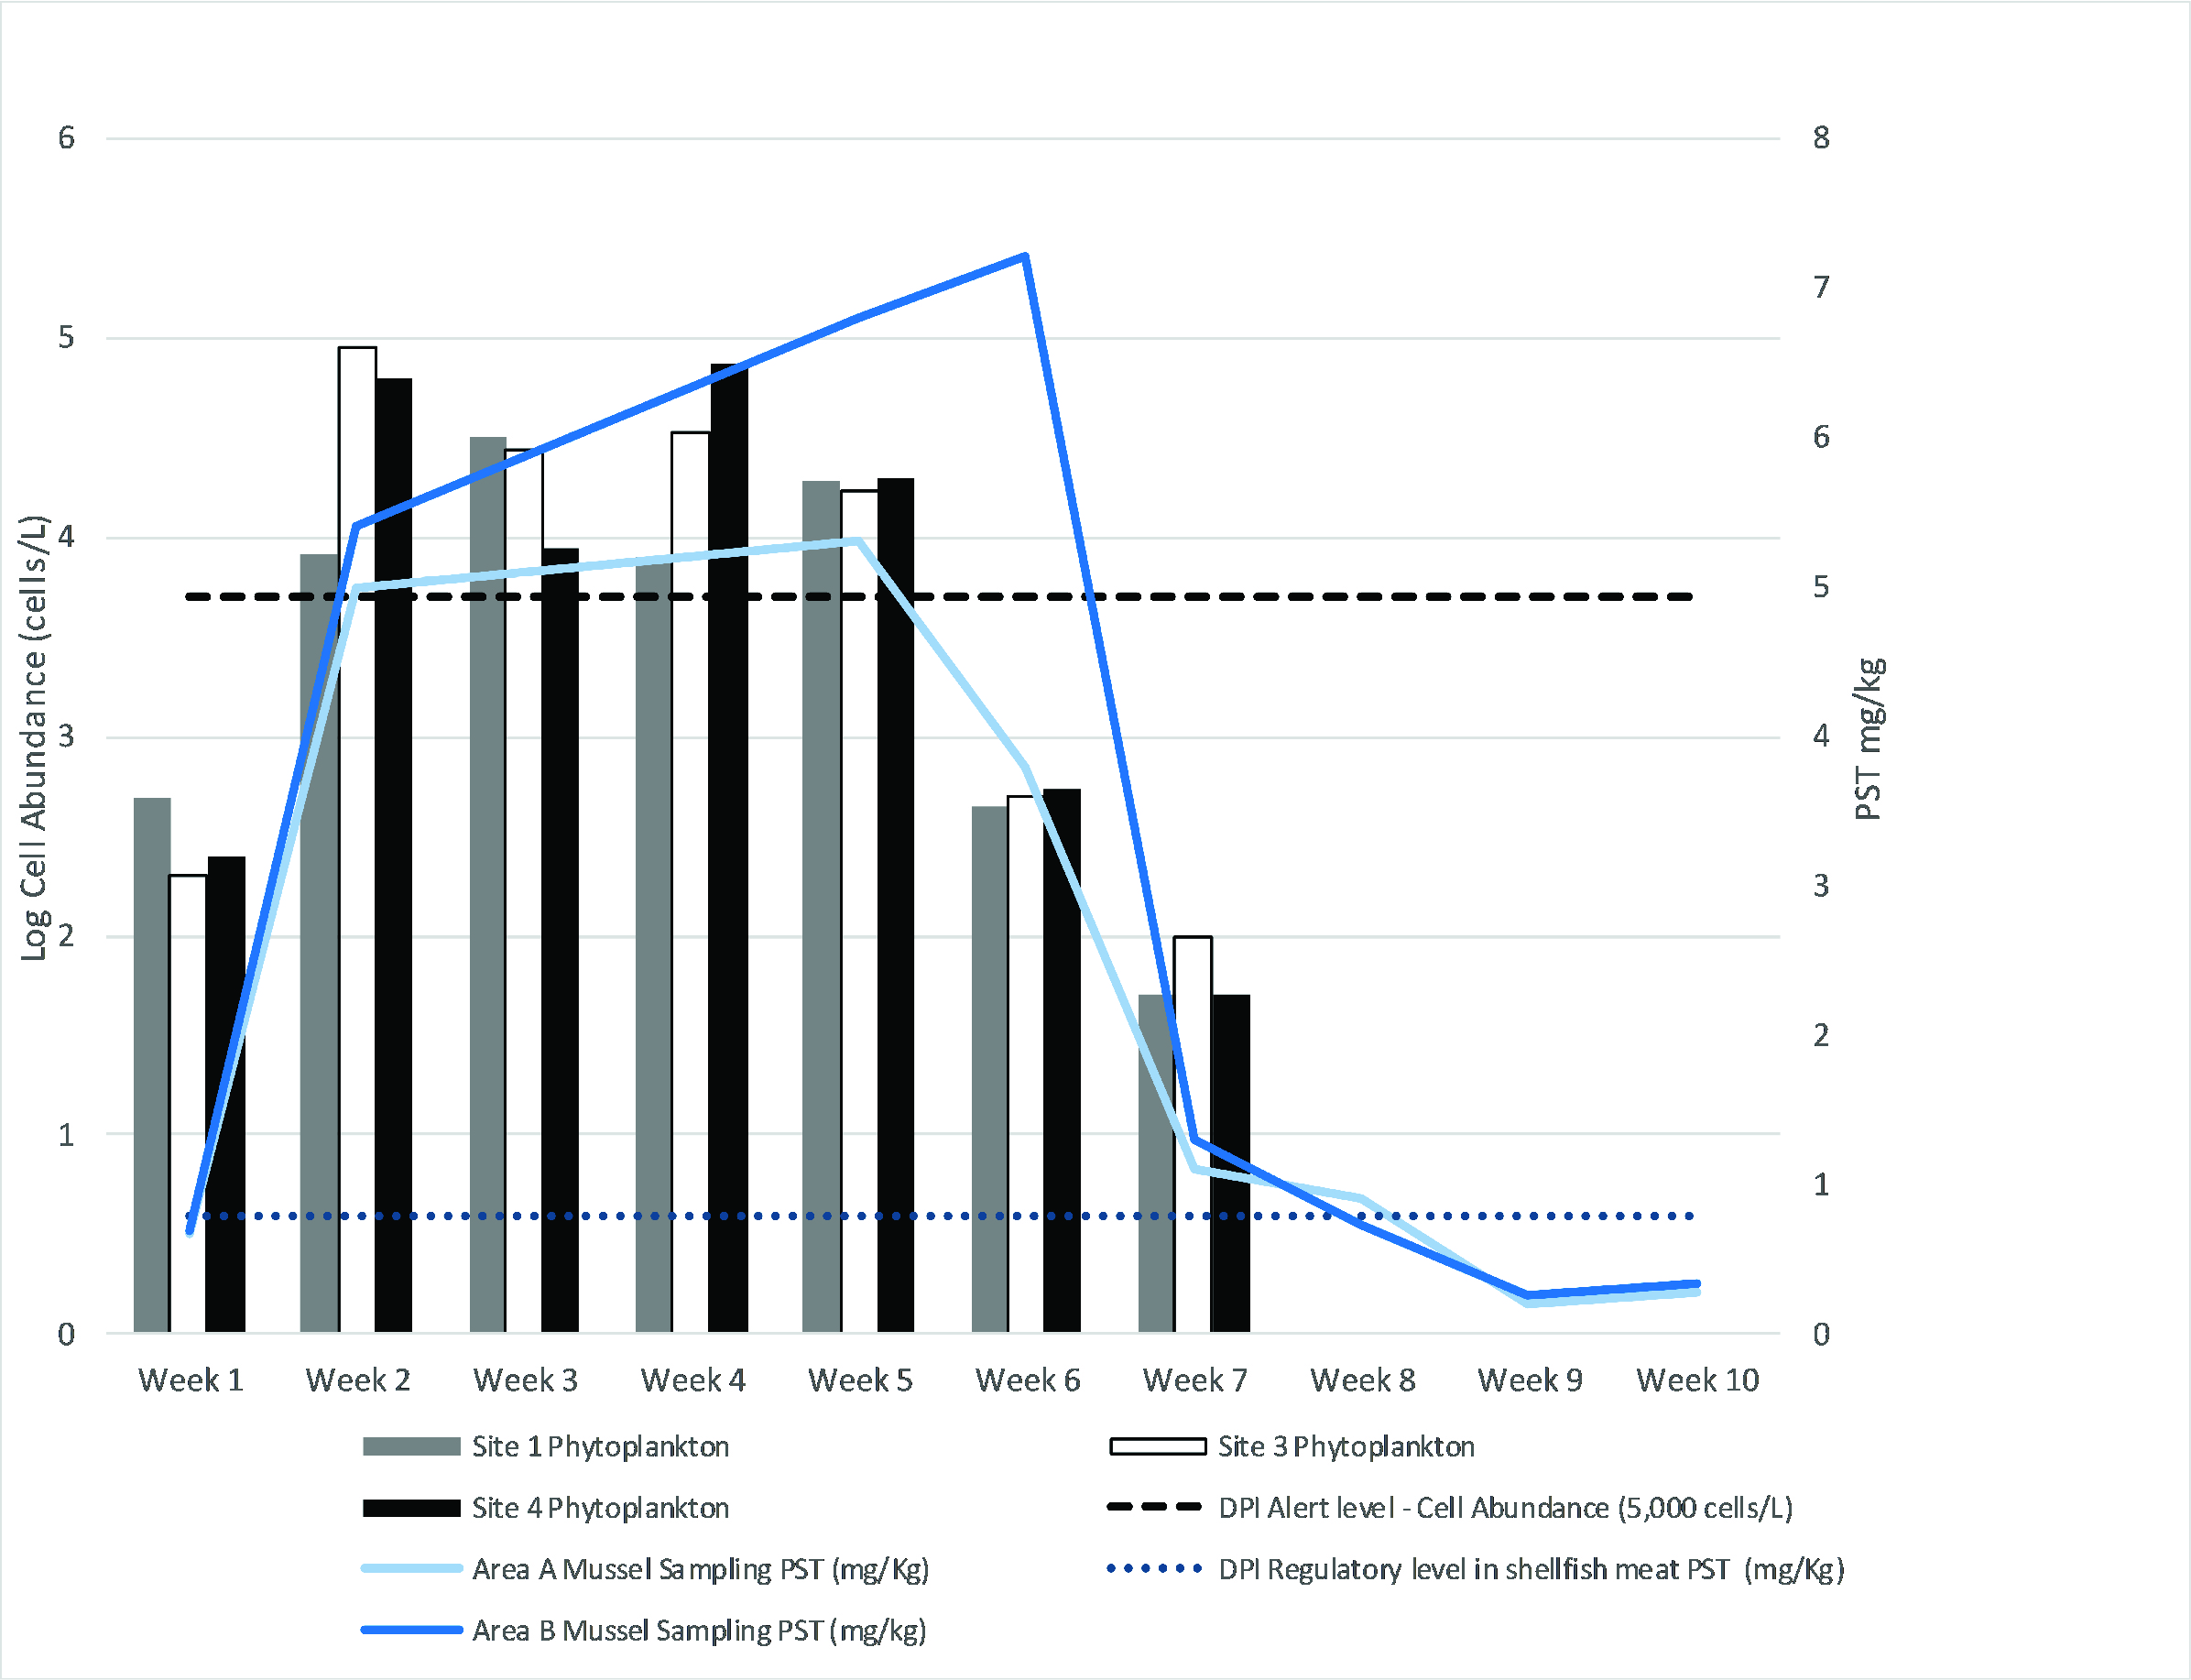
Harmful algae and their biotoxins have been routinely monitored within Twofold Bay since 2005. Historically, there is a low incidence of Alexandrium blooms in NSW (Figure 4). During October 2016, an unprecedented bloom of Alexandrium pacificum was detected within Twofold Bay reaching a maximum cell abundance of 89,000 cells L-1, exceeding the alert level to issue a public health warning of 5000 cells L-1 (Barua et al. unpublished data) (Figure 4). The bloom persisted for at least eight weeks, with the regulatory limit for PSTs exceeded in nine Blue Mussel (Mytilus galloprovincialis) samples collected from within the bay (maximum 7.2 mg kg-1; regulatory limit 0.8 mg kg-1 PST saxitoxin equivalent, Figure 5).
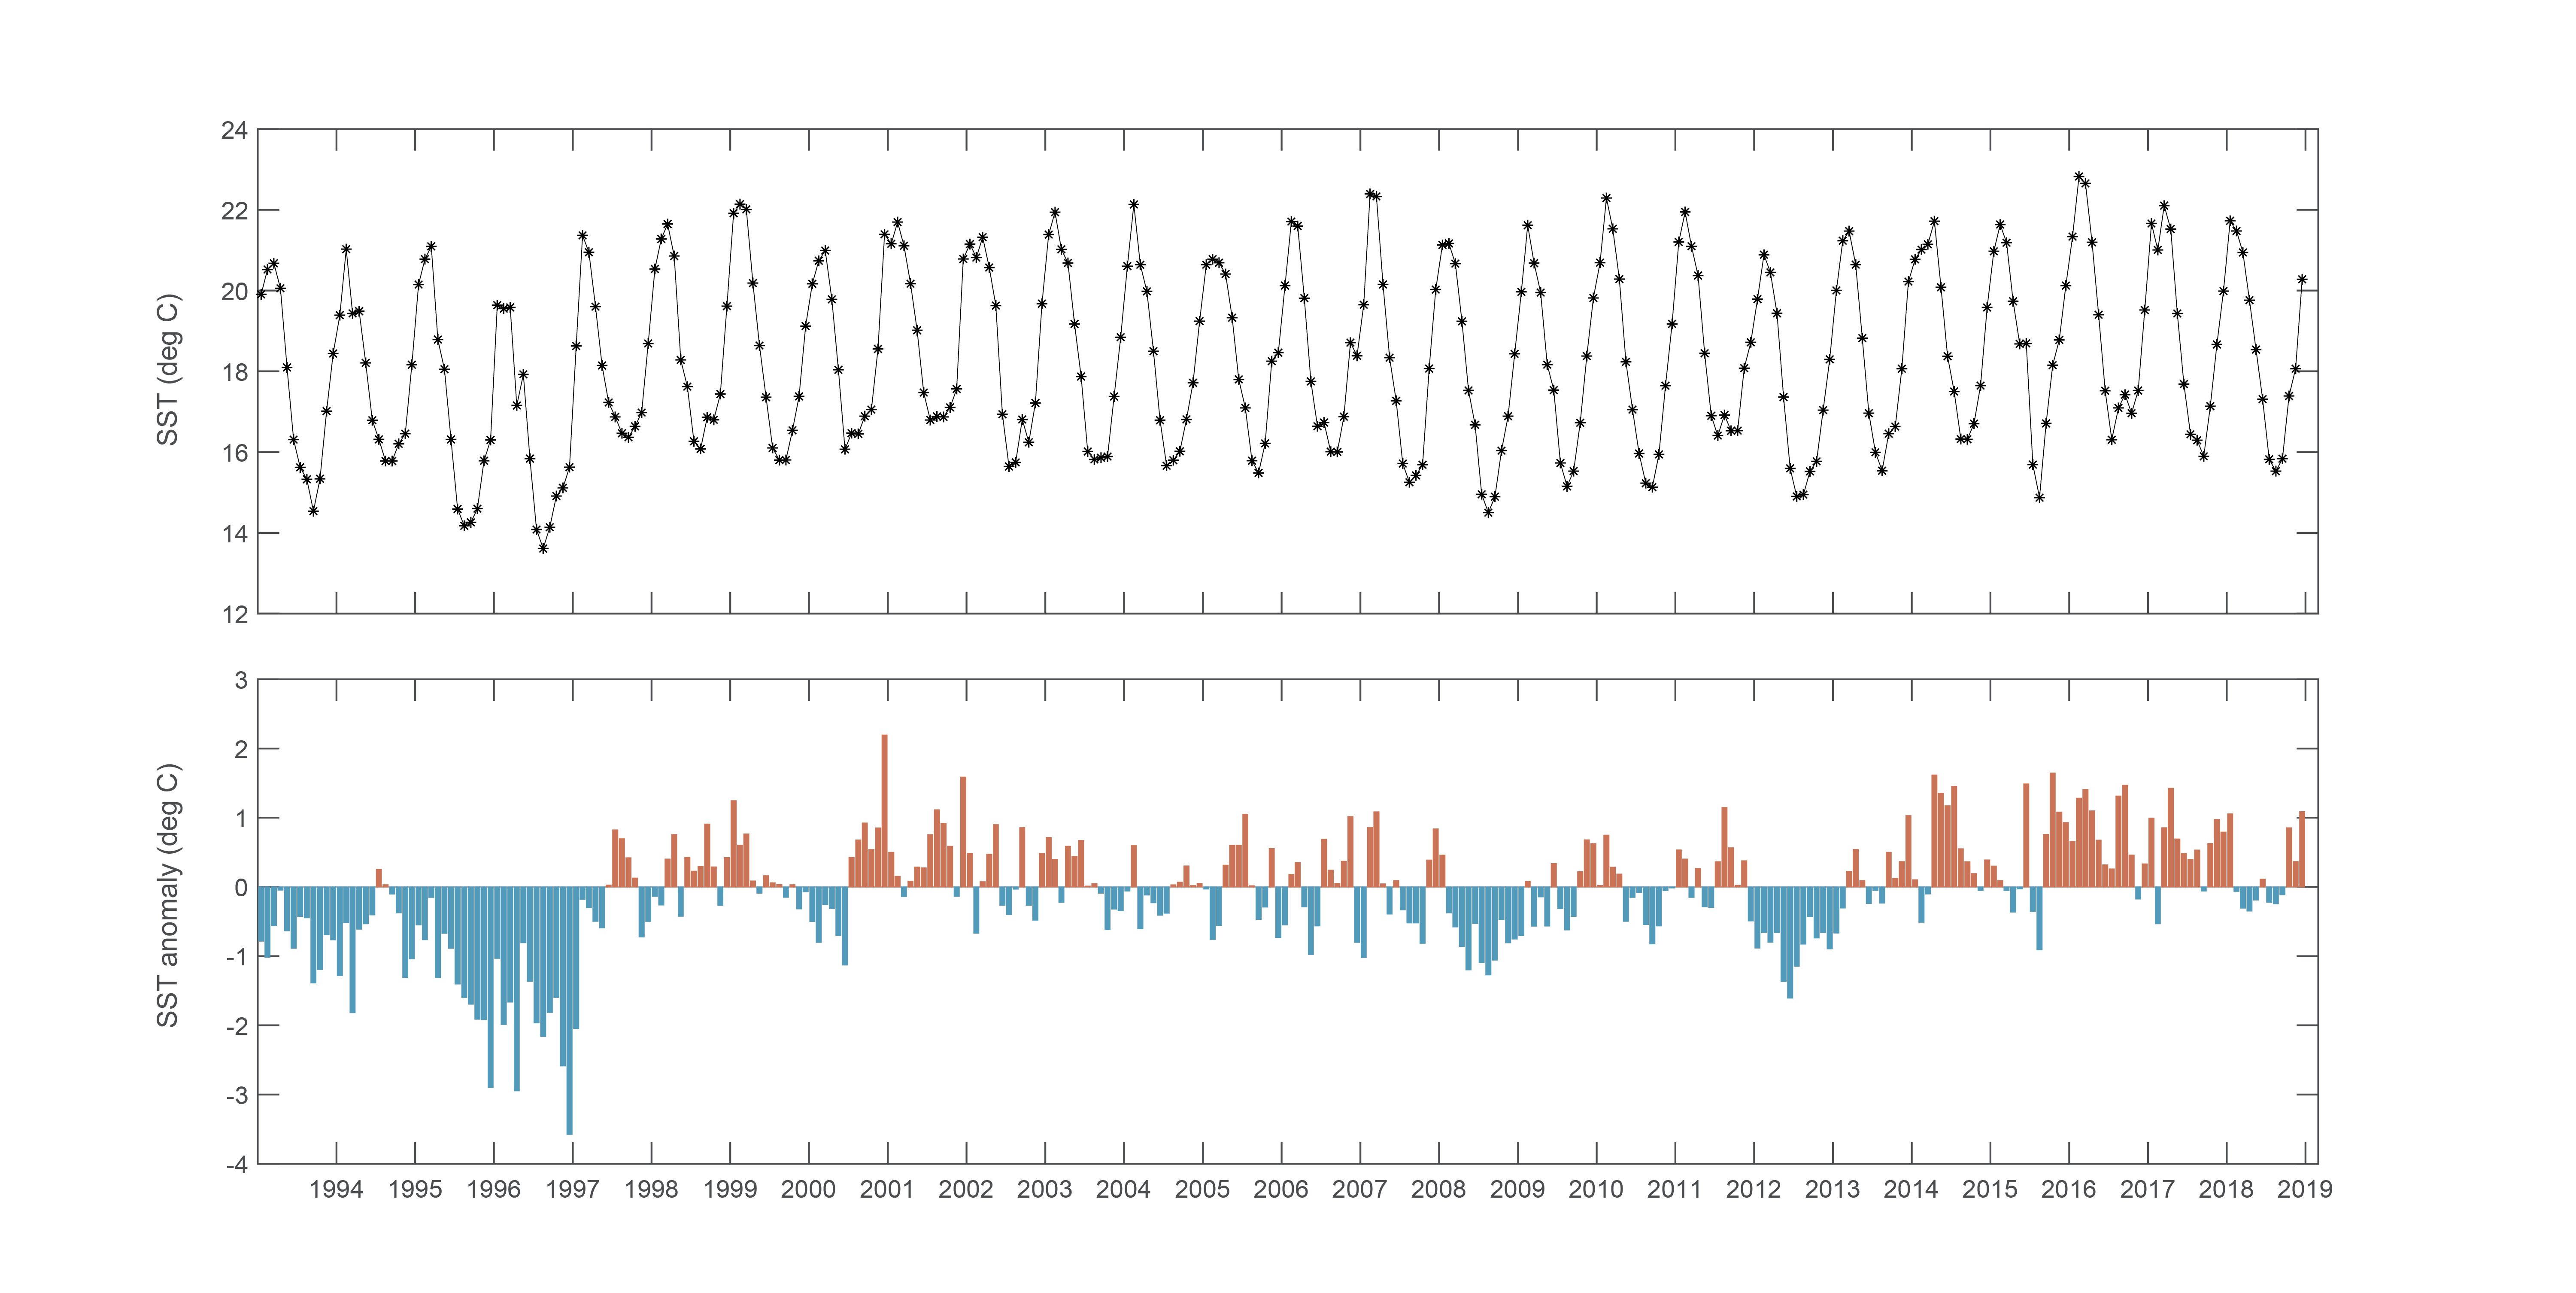
Although highest cell concentrations of Alexandrium were detected within Twofold Bay, cell abundances ranging from 1,200 - 15,000 cells L-1 were detected up to 13 km north and 21 km south along the adjacent coastline. Further evidence of the bloom was detected as far as the Georges River to the north, and Wonboyn Lake to the south. SST data on 24 October 2016 indicates cold water (in the bottom 20th percentile) extending north from Bass Strait and influencing Twofold Bay (Figure 6), after a prolonged period of warmer than usual conditions (Figure 7). This cold, nutrient-rich water, is likely to have stimulated phytoplankton growth in the Bay at this time.
The mussel harvest areas within Twofold Bay were closed during the 2016 bloom event and no shellfish exceeding the regulatory limits for PST were marketed. Advice from the regulatory authority during the bloom recommended that people not consume shellfish, sea urchins or fin fish species that are consumed whole (e.g., sardines), and to avoid consumption of the viscera from crustaceans (e.g., lobster) and gastropods (e.g., abalone) collected or caught from Twofold Bay. As a result of these warnings, no illnesses were reported from seafood consumers.
These time series are two examples of local monitoring programs designed to manage potential food safety risks from algal toxins when shellfish for human consumption are being collected from wild harvest areas or aquaculture operations. Wild harvest beaches or shellfish aquaculture areas are routinely closed if potentially harmful algae and/or algal toxins are detected above regulatory limits. In NSW, there were outbreaks of illness from DSTs in pipis in 1997 (northern NSW coast; 102 cases including, 46 anecdotal (Quaine et al., 1997)) and in 1998 (mid north NSW coast; >20 cases (Ajani et al, 2001; MacKenzie et al., 2002)). Since the establishment of routine monitoring for commercial wild harvest of pipis, there have been no reports of illness. Similarly, since the establishment of routine phytoplankton and biotoxin monitoring in NSW aquaculture growing areas, no illnesses related to algal toxins has been reported. In Twofold Bay, the Alexandrium bloom observed in 2016 resulted in the closure of the mussel harvest areas. Health warnings from the regulatory authority were extended to other species that may potentially have accumulated toxins, with the outcome that no illnesses were reported from seafood consumers.
In addition to human illness, the cost of harmful algal outbreaks can be significant and can include a loss of stock, a loss of market access, and damage to the reputation of the seafood industry. For example, the NSW oyster industry, which constitutes half of the Australian oyster industry, is valued at $55 million (2017-2018). There are ~25 closures per year due to HABs, with each closure lasting one week on average. At a conservative estimate of $100,000 per closure (NSW DPI), this equates to $2.5 million loss to the industry per year. Early warning of HABs will result in increased profit to the shellfish farmers and an increased confidence of Australian shellfish consumers. A more comprehensive understanding of the triggers of these events, and the potential impact of climate change (Glibert & Burford, 2017), is critical so that we can improve the forecasting and management of these toxic episodes, safeguarding the industry and consumers alike.
Ajani, P., Brett, S., Krogh, M., Scanes, P., Webster, G., & Armand, L. (2013). The risk of harmful algal blooms (HABs) in the oyster-growing estuaries of New South Wales, Australia. Environmental Monitoring and Assessment, 185(6), 5295-5316. doi:10.1007/s10661-012-2946-9
Ajani, P., Hallegraeff, G., & Pritchard, T. (2001). Historic overview of algal blooms in marine and estuarine waters of New South Wales, Australia. Proceedings of the Linnean Society of New South Wales, 123, 1-22. Retrieved from <Go to ISI>://WOS:000174087300002
Ajani, P., Larsson, M. E., Rubio, A., Bush, S., Brett, S., & Farrell, H. (2016). Modelling bloom formation of the toxic dinoflagellates Dinophysis acuminata and Dinophysis caudata in a highly modified estuary, south eastern Australia. Estuarine, Coastal and Shelf Science, 183, 95-106. doi: 10.1016/j.ecss.2016.10.020
Ajani, P. A., Harwood, D. T., & Murray, S. A. (2017). Recent trends in marine phycotoxins from Australian coastal waters. Marine Drugs, 15, 33. doi:doi:10.3390/md15020033
ASQAAC. (2016). The Australian Shellfish Quality Assurance Program Operations Manual. In (pp. 46). Canberra, Australia: Australian Shellfish Quality Assurance Advisory Committee.
Deeds, J. R., Landsberg, J. H., Etheridge, S. M., Pitcher, G. C., & Longan, S. W. (2008). Non-traditional vectors for paralytic shellfish poisoning. Marine Drugs, 6(2), 308-348.
Farrell, H., Ajani, P., Murray, S., Baker, P., Webster, G., Brett, S., & Zammit, A. (2018). Diarrhetic Shellfish Toxin Monitoring in Commercial Wild Harvest Bivalve Shellfish in New South Wales, Australia. Toxins, 10(11), 446. doi:10.3390/toxins10110446
Farrell, H., Brett, S., Ajani, P., & Murray, S. (2013). Distribution of the genus Alexandrium (Halim) and paralytic shellfish toxins along the coastline of New South Wales, Australia. Marine Pollution Bulletin, 72(1), 133-145. doi:10.1016/j.marpolbul.2013.04.009
Farrell, H., Brett, S., Webster, G., Baker, P., & Zammit, A. (2015, 27-31 October 2014). A summary of harmful algal bloom monitoring and risk assessment within shellfish harvest areas in New South Wales, Australia. . Paper presented at the 16th International Conference on Harmful Algae, Wellington, New Zealand.
Glibert, P. M., & Burford, M. A. (2017). Globally changing nutrient loads and harmful algal blooms: Recent advances, new paradigms, and continuing challenges. Oceanography and Marine Biology, Vol 38, 30(1), 58-69.
MacKenzie, L., Holland, P., McNabb, P., Beuzenberg, V., Selwood, A., & Suzuki, T. (2002). Complex toxin profiles in phytoplankton and Greenshell mussels (Perna canaliculus), revealed by LC–MS/MS analysis. Toxicon, 40(9), 1321-1330. doi: 10.1016/S0041-0101(02)00143-5
NSW Food Authority. (2015). Marine Biotoxin Management Plan. Retrieved from Newington, NSW: http://www.foodauthority.nsw.gov.au/_Documents/industry/marine_biotoxin_management_plan.pdf
NSW Food Authority. (2017). Phytoplankton and biotoxins in NSW shellfish aquaculture areas: risk assessment. Retrieved from http://www.foodauthority.nsw.gov.au/_Documents/scienceandtechnical/phytoplankton_and_biotoxin_risk_assessment.pdf
Quaine, J., Kraa, E., Holloway, J., White, K., McCarthy, R., Delpech, V., . . . McAnulty, J. (1997). Outbreak of gastroenteritis linked to eating pipis. Retrieved from
Reguera, B., Velo-Suárez, L., Raine, R., & Gil Park, M. (2012). Harmful Dinophysis species: A review (Vol. 14).
Figure 1
Time series of total Dinophysis spp. abundance for South Ballina Beach (1998-2018). Note that routine monitoring did not occur between 2004 and 2011, as shellfish were not collected for human consumption during this time. Blue line= least squares regression (smoothed); grey= confidence interval (as standard error) around the fitted line.
Figure 2
Seasonal cycles of Dinophysis acuminata (1998-2003), Dinophysis caudata (1998-2003) and Dinophysis spp. (2012-2018) from South Ballina Beach. Blue line = loess smoother; grey= confidence interval around the fitted line.
Figure 3
Time series of the number of positive and negative diarrhetic shellfish toxin (DST) results from shellfish samples from South Ballina Beach (1999-2018). Samples were collected following reports of elevated Dinophysis results. Data were not collected between 2004 and 2011, as shellfish were not collected for human consumption during this time. Biotoxin sample results from 2015=2017 (Farrell et al. 2018) and 2018 (ongoing end-product market survey) for South Ballina Beach are also included in the figure.
Figure 4
Abundance of Alexandrium spp. including A. pacificum in mussels from Twofold Bay, NSW. Note the different abundance scales for each species, and for total Alexandrium. Blue line = loess smoother; grey= confidence interval around the fitted line.
Figure 5
A. pacificum cell abundance, paralytic shellfish toxins concentrations, and regulatory limits for the October 2016 bloom.
Figure 6
Three day mean sea surface temperature of the south-eastern Australian coastline on 24 October 2016 showing warm sea-surface temperature extending from the north as red and cold nutrient-rich water extending from Bass Strait in the south as blue (Figure courtesy of Charitha Pattiaratchi, Integrated Marine Observing System (IMOS) Ocean Glider Facility)
Figure 7
Mean monthly Sea Surface Temperature (SST) and SST anomaly (°C) at Twofold Bay, NSW from 2000 to 2019. (Figure courtesy of Charitha Pattiaratchi, Integrated Marine Observing System (IMOS) Ocean Glider Facility)
Download this Time Series Report
Citing this report:
Farell H, Ajani P, Murray S, Baker P, Webster G, Brett S, Zammitt A, Barua A, Hill D. (2020) Time series of harmful agal blooms in New South Wales. In Richardson A.J, Eriksen R, Moltmann T, Hodgson-Johnston I, Wallis J.R. (Eds). State and Trends of Australia’s Ocean Report. doi: 10.26198/5e16acea49e84
doi: 10.26198/5e16acea49e84
Citing the Report
Richardson A.J, Eriksen R, Moltmann T, Hodgson-Johnston I, Wallis J.R. (2020). State and Trends of Australia’s Ocean Report, Integrated Marine Observing System (IMOS).

The State and Trends of Australia's Ocean Report was supported by IMOS. IMOS gratefully acknowledges the additional support provided by the Commonwealth Scientific and Industrial Research Organisation (CSIRO).
The State and Trends of Australia's Ocean website is maintained by IMOS.

Australia’s Integrated Marine Observing System (IMOS) is enabled by the National Collaborative Research Infrastructure Strategy (NCRIS). It is operated by a consortium of institutions as an unincorporated joint venture, with the University of Tasmania as Lead Agent.
Disclaimer:
You accept all risks and responsibility for losses, damages, costs and other consequences resulting directly or indirectly from using this site and any information or material available from it. While the Integrated Marine Observing System (IMOS) has taken reasonable steps to ensure that the information on this website and related publication is correct, it provides no warranty or guarantee that information provided by the authors is accurate, complete or up-to-date. IMOS does not accept any responsibility or liability for any actions taken as a result of, or in reliance on, information on its website or publication. Users should check with the originating authors to confirm the accuracy of the information before taking any action in reliance on that information.
If you believe any information on this website or in the related publication is inaccurate, out of date or misleading, please bring it to our attention by contacting the authors directly or emailing us at IMOS@imos.org.au
Images and Information:
All information on this website remains the property of those who authored it. All images on this website are licensed through Adobe Stock, Shutterstock, or have permission from the original owner.

