Physical and Chemical

1.2

Sea Surface Temperature Variability

Contributors

Charitha B. Pattiaratchi1,2

Yasha Hetzel1,2

1 Oceans Graduate School, The University of Western Australia, Perth, WA, Australia
2 UWA Oceans Institute, The University of Western Australia, Perth, WA, Australia

Key Information

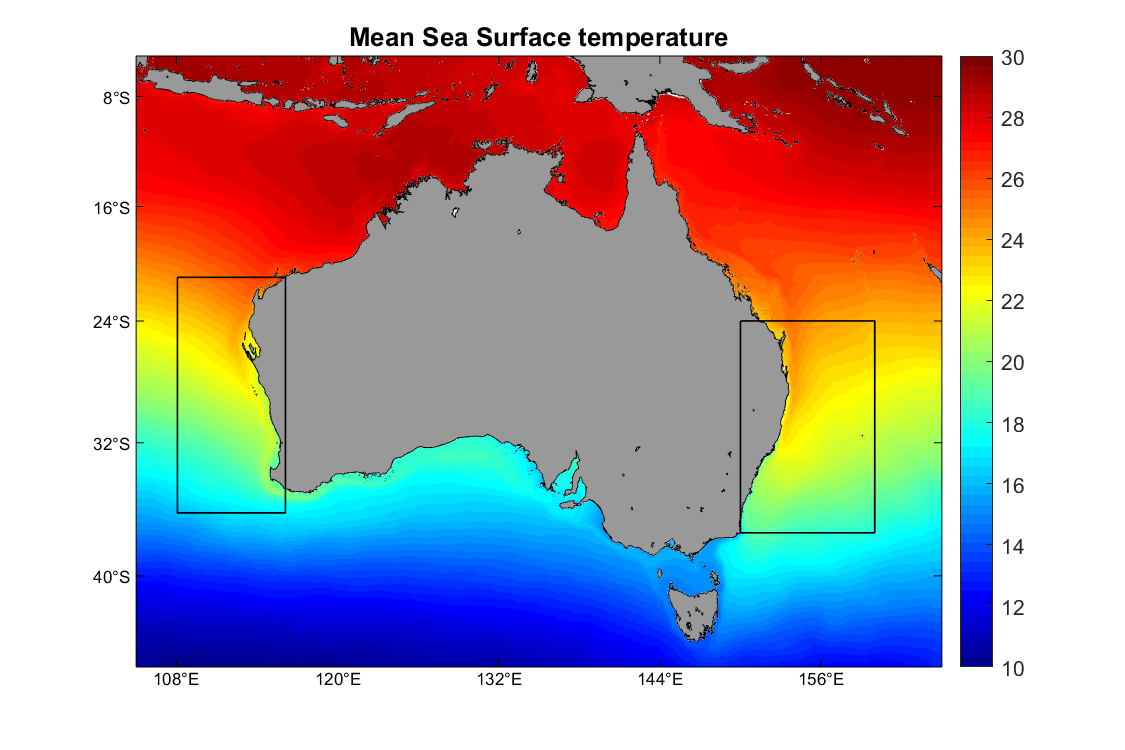
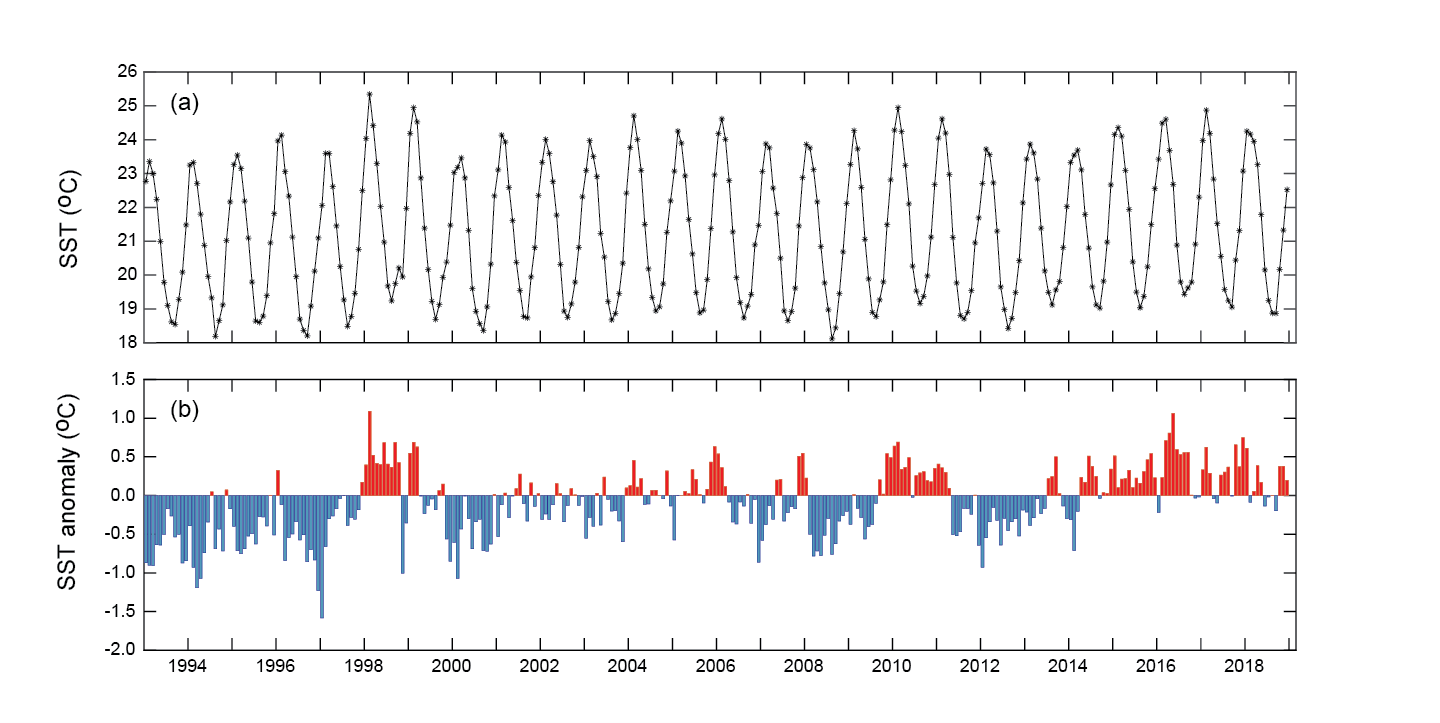
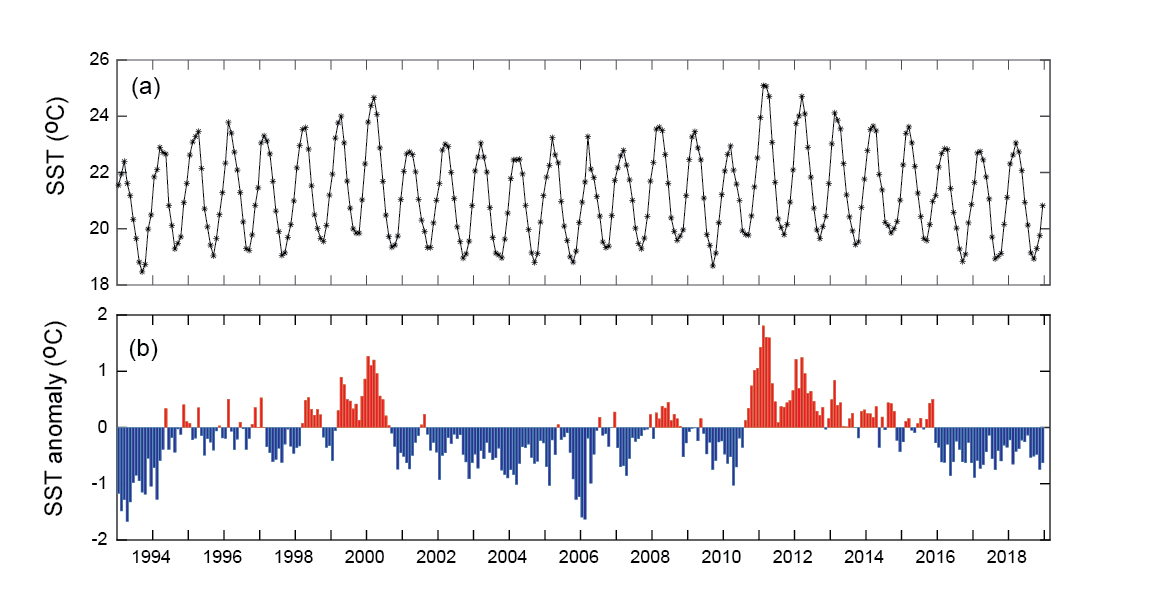
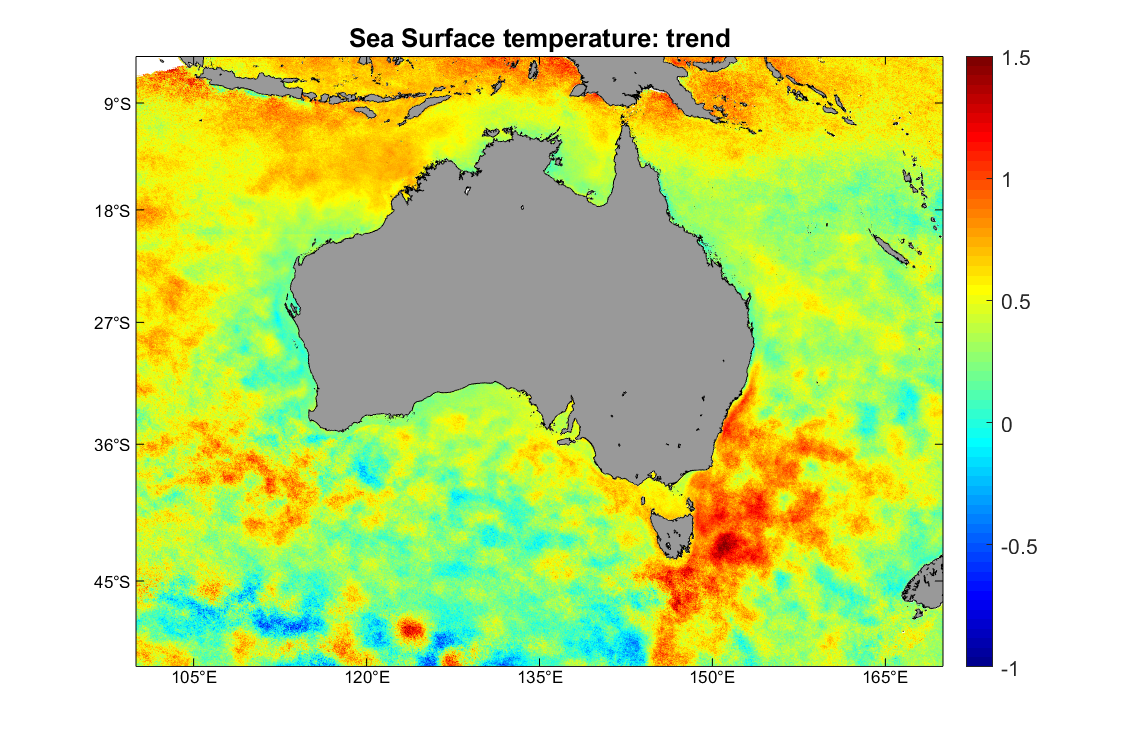
Variability in sea surface temperature (SST) at seasonal, inter-annual and longer timescales reflect changes in both atmospheric and oceanic processes. SST is a key parameter that influence the heat transfer between the ocean and atmosphere and therefore it is important for regulating climate and its variability, both regionally and globally. SST also have a major influence on marine ecosystem function. Monthly SST and SST anomaly data, derived from satellite data between 1993 and 2018, were used to examine the SST variability in the East Australian and Leeuwin Current regions and indicated strong seasonal and inter-annual variability. There were periods of warm and cool periods where the mean monthly SST changed by up to 2oC at inter-annual scales that were mainly associated with El Niño and La Niña events. In the south-east, the SST has been increasing at a rate of ~1oC per decade whist no longer term changes have been observed along the west coast.

Keywords

Atmospheric currents, oceanic currents, SST anomalies, El Niño and LaNiña events

Sea Surface Temperature Variability

Sea surface temperature (SST) reflects processes at the interface between the ocean and atmosphere and is an essential parameter in understanding ocean variability. Patterns of SST variability at seasonal, inter-annual and longer timescales result from a combination of atmospheric and oceanic processes. These SST patterns may be due to atmospheric and ocean circulation variability that imprint upon the SST field. As SST controls the transfer of heat energy from the oceans to the atmosphere, it plays a key role in regulating climate and its variability, both regionally and globally.

The Australian continent is surrounded by surface and subsurface boundary currents that flow along the continental shelf/slope. These currents are components of the sub-tropical gyre circulation in the South Indian and South Pacific oceans and  include the East Australian (east coast) and Leeuwin Currents (west coast). Both these currents contribute to the poleward heat and mass transport along the east and west coasts (Wijeratne, Pattiaratchi, & Proctor, 2018). The Indonesian Archipelago, to the north of the Australian continent, allows for the transport of warmer, less saline Pacific Ocean water into the Indian Ocean. This is the only channel in the tropics where there is interocean exchange of water masses. Thus the oceans around the Australian continent are influenced by the dynamics of the tropical Pacific Ocean: the east coast is directly impacted as the western margin of the south Pacific Ocean and the west coast through the Indonesian Archipelago.

Longer-term changes in SST along the west and east coasts are a proxy for the variability in the major current systems. As ocean temperature also influences the physiology and distribution of marine life, changes in SST potentially provides insights into dynamics of marine communities.

To examine the sea surface temperature (SST) variability in the East Australian Current and Leeuwin Current regions, we used satellite data from the AVHRR sensors (onboard NOAA-11 to NOAA-19) from 1993-2018. We used mean monthly level 3 gridded (0.02° x 0.02° resolution) night skin temperature data (AODN dataset: “IMOS - SRS - SST - L3S - Single Sensor - 1 day - night time – Australia”). The SST climatology developed by Wijffels et al. (2018) was used to obtain monthly SST anomalies (AODN dataset: SST Atlas of Australian Regional Seas (SSTAARS) - Daily climatology fit).

Monthly SST and SST anomaly data were used to obtain the area average in two regions off the east (24°N–37.5°S, 150°–160°E) and west coasts of Australia (21°N–36°S, 108°–116°E, Figure 1).

Monthly mean SSTs indicated strong seasonal variability off both the east and west coasts. Along the east coast, the mean seasonal change is ~5oC (19-24oC), with the annual maximum temperature during February (Figure 2a). Along the west coast, the mean seasonal change is ~4oC (19-23oC), with the annual maximum temperature during March (Figure 3a).

Over the 1993-2016 period, the mean trend of SST was variable around Australia (Figure 4). Along the south-east, the mean trend was positive at ~1oC decade-1, whilst along the west coast the trend was negligible. However, over the 25-year period, there was significant variability along both coasts. Along the east coast, five different changes can be identified (Figure 2a ): from 1993-1998 there was an increase in the annual maximum SST by ~2oC, with a decrease from 1998-2000 by a similar amount. From 2000-2010 there was a gradual increase in the SST by ~1.5oC, a decrease of ~1.2oC over 2010-2012, and a similar increase from 2012-2017. By contrast, along the west coast, there were only three main changes (Figure 3a), each lasting longer: over the period 1993-2000 there was an increase in the annual maximum SST by ~2oC with a rapid decrease from 2000-2001 by a similar amount. From 2001-2010, maximum monthly SST was relatively constant. SST then increased by ~2oC over 1 year (2010-2011) and there was a gradual decrease of ~1.5oC from 2011-2018. These changes were reflected in the mean monthly SST anomalies along both coasts (Figure 2b, Figure 3b). Increases in SST along both east and west coasts were related to strong La Niña events in 1999 and 2011 when the mean monthly SSTs and associated anomalies were at a maximum. The pattern of mean monthly SST and SST anomalies, along both coasts, indicated that in the years prior to a La Niña event, temperatures increased, with a rapid decrease over a 1-2 year period at the cessation of the event. However, along the east coast, mean monthly SST anomalies have been positive since mid-2014, whilst along the west coast the anomalies have been negative since 2016.

Mean monthly SST and SST anomalies, along both coasts, indicate strong seasonal and inter-annual variability. Although there has been a linear increase in SST along the east coast over the period 1993-2016, no changes have been observed along the west coast. However, there have been many increases/decreases in mean monthly SST by up to 2oC at inter-annual scales, mainly associated with El Niño andLa Niña events. These changes are comparable to the annual cycle of SST changes (4oC and 5oC along the west and east coasts, respectively).

This SST variability has large influences on coastal ecosystems. For example, the 2011 La Niña event resulted in a severe marine heatwave along the west coast (Pearce & Feng, 2013) that resulted in significant changes to the whole ecosystem (Babcock et al., 2019; Cannell, Thomas, Schoepf, Pattiaratchi, & Fraser, 2019; Wernberg et al., 2013) that included invertebrate fisheries (Caputi et al., 2016) and benthic communities, containing habitat-forming groups such as kelp, seagrass and corals (Kendrick et al., 2019).

Babcock, R. C., Bustamante, R. H., Fulton, E. A., Fulton, D. J., Haywood, M. D. E., Hobday, A. J., . . . Vanderklift, M. A. (2019). Severe continental-scale impacts of climate change are happening now: extreme climate events impact marine habitat forming communities along 45% of Australia’s coast. Frontiers in Marine Science, 6(411). doi:10.3389/fmars.2019.00411

Cannell, B., Thomas, P. G., Schoepf, V., Pattiaratchi, C., & Fraser, M. W. (2019). Impacts of marine heatwaves. In E Techera & G Winter (eds), Marine extremes: ocean safety, marine health and the blue economy: Routledge, Abingdon, Oxon.

Caputi, N., Kangas, M., Denham, A., Feng, M., Pearce, A., Hetzel, Y., & Chandrapavan, A. (2016). Management adaptation of invertebrate fisheries to an extreme marine heat wave event at a global warming hot spot. Ecology and Evolution, 6(11), 3583-3593. doi:10.1002/ece3.2137

Kendrick, G. A., Nowicki, R. J., Olsen, Y. S., Strydom, S., Fraser, M. W., Sinclair, E. A., . . . Orth, R. J. (2019). A systematic review of how multiple stressors from an extreme event drove ecosystem-wide loss of resilience in an iconic seagrass community. Frontiers in Marine Science, 6, 15. doi:10.3389/fmars.2019.00455

Pearce, A. F., & Feng, M. (2013). The rise and fall of the "marine heat wave" off Western Australia during the summer of 2010/2011. Journal of Marine Systems, 111, 139-156. doi:10.1016/j.jmarsys.2012.10.009

Wernberg, T., Smale, D. A., Tuya, F., Thomsen, M. S., Langlois, T. J., de Bettignies, T., . . . Rousseaux, C. S. (2013). An extreme climatic event alters marine ecosystem structure in a global biodiversity hotspot. Nature Climate Change, 3(1), 78-82. doi:10.1038/nclimate1627

Wijeratne, S., Pattiaratchi, C., & Proctor, R. (2018). Estimates of surface and subsurface boundary current transport around Australia. Journal of Geophysical Research-Oceans, 123(5), 3444-3466. doi:10.1029/2017jc013221

Wijffels, S. E., Beggs, H., Griffin, C., Middleton, J. F., Cahill, M., King, E., . . . Sutton, P. (2018). A fine spatial-scale sea surface temperature atlas of the Australian regional seas (SSTAARS): Seasonal variability and trends around Australasia and New Zealand revisited. Journal of Marine Systems, 187, 156-196. doi:10.1016/j.jmarsys.2018.07.005

Figure 1

Location of boxes (east and west) used to obtain time series of SST and SST anomalies. The background is the mean SST over the period 1993-2016 obtained from SSTAARS (Wijffels et al., 2018). Units of SST are in ⁰C.

Figure 2

Time series of: (a) monthly sea surface temperature, and (b) monthly sea surface temperature anomaly for the east coast of Australia. Monthly SSTs were averaged over the box shown in Figure 1.

Figure 3

Time series of: (a) monthly sea surface temperature, and (b) monthly sea surface temperature anomaly for the west coast of Australia. Monthly SST anomalies were averaged over the box shown in Figure 1.

Figure 4

The mean sea surface temperature trend (oC.decade-1) from 1993-2016 (data from Wijffels et al., 2018).

Download this Time Series Report

Citing this report: 

Pattiaratchi C.B, Hetzel Y. (2020) Sea Surface Temperature Variability. In Richardson A.J, Eriksen R, Moltmann T, Hodgson-Johnston I, Wallis J.R. (Eds). State and Trends of Australia’s Ocean Report. doi: 10.26198/5e16a1c649e74

doi: 10.26198/5e16a1c649e74

Access the Data

Access the data that contributes to this time-series by clicking the icons below

11. SRS-02

Satellite Remote Sensing

Citing the Report

Richardson A.J, Eriksen R, Moltmann T, Hodgson-Johnston I, Wallis J.R. (2020). State and Trends of Australia’s Ocean Report, Integrated Marine Observing System (IMOS).

IMOS_logo-stacked-reversed-01

The State and Trends of Australia's Ocean Report was supported by IMOS. IMOS gratefully acknowledges the additional support provided by the Commonwealth Scientific and Industrial Research Organisation (CSIRO).

The State and Trends of Australia's Ocean website is maintained by IMOS.


NCRIS-PROVIDER-REV

Australia’s Integrated Marine Observing System (IMOS) is enabled by the National Collaborative Research Infrastructure Strategy (NCRIS). It is operated by a consortium of institutions as an unincorporated joint venture, with the University of Tasmania as Lead Agent.

Disclaimer:

You accept all risks and responsibility for losses, damages, costs and other consequences resulting directly or indirectly from using this site and any information or material available from it. While the Integrated Marine Observing System (IMOS) has taken reasonable steps to ensure that the information on this website and related publication is correct, it provides no warranty or guarantee that information provided by the authors is accurate, complete or up-to-date. IMOS does not accept any responsibility or liability for any actions taken as a result of, or in reliance on, information on its website or publication. Users should check with the originating authors to confirm the accuracy of the information before taking any action in reliance on that information.

If you believe any information on this website or in the related publication is inaccurate, out of date or misleading, please bring it to our attention by contacting the authors directly or emailing us at IMOS@imos.org.au


Images and Information:

All information on this website remains the property of those who authored it. All images on this website are licensed through Adobe Stock, Shutterstock, or have permission from the original owner.