Physical and Chemical
1.5
Spatial and temporal trends in concentrations of nutrients
Contributors
Edward Butler1
Michele Skuza2
Christian Lønborg2
1 Australian Institute of Marine Science, Arafura Timor Research Facility, NT, Australia
2 Australian Institute of Marine Science, Townsville, QLD, Australia
Key Information
Nutrient time series from the seven IMOS NRS show no discernible trends. The three long-term NRS (>50 years) show a decline in silica over multiple decades (most dramatic at MAI), a decline in phosphate more recently, and mixed responses for nitrate.
Keywords
meso-scale, surface waters, East Australian Current, Leeuwin Current
Spatial and temporal trends in concentrations of nutrients
In Australian coastal waters distant from urban centres and river mouths, marine primary production is said to be chiefly limited by availability of N (Radke et al., 2017; Thompson et al., 2011). In practice, labile organic N (Box 1) and atmospheric N2-fixation can offset the N deficit; trace elements can also influence growth (Box 2). Sustained observations of N, P and Si as part of the Integrated Marine Observing System (IMOS) provide a circum-continental baseline for nutrients that can be used to assess changes from climatic and other anthropogenic pressures.
Nutrient concentrations of Australian surface waters grade from the tropics to the cool temperate regions. They increase with depth below the surface mixed layer as dissolved nutrients are returned to the water column from decomposition of sinking particulate matter and physical processes, such as intrusions of deeper water. Beyond the estuaries and close inshore, they can be characterised broadly into three provinces: North-West (tropical wet/dry climate, macrotidal, broad continental shelf) low N and P, high Si; North-East (tropical wet/dry climate, mesotidal, narrower continental shelf and barrier reef) – very low N and P, intermediate Si; and South (temperate climate, microtidal, seasonal deep mixing) – intermediate N and P, low Si. The transition between these provinces is mediated by the two major, poleward currents on the east (East Australian Current (EAC)) and west (Leeuwin Current (LC)) coasts of Australia and their subsidiary systems. Regional oceanographic influences can be modified by local mechanisms, as observed at Kangaroo Island (van Ruth et al., 2018). Seasonal variability in nutrient concentrations within any year is generally greater than interannual variability.
Surface waters off the east coast of Australia have warmed by up to 2°C over the past 70 years, with greater warming in the south (e.g., Maria Island) than further north (e.g., Port Hacking) (Figure 1). This is a consequence of global warming and its influence on the intensification of the poleward-flowing East Australian Current (EAC) (Cai, Shi, Cowan, Bi, & Ribbe, 2005), which is distributing more warm-water to southern Australia (Ridgway, 2007). This increasing strength of the EAC has contributed to ocean warming off southeast Australia ~3–4 times the global average (Ridgway, 2007).
Here we compare the IMOS copepod data from three National Reference Stations in eastern Australia – Maria Island (42.6°S), Port Hacking (34.1°S) and Yongala (19.3°S). We chose these regions because there was historical data in each region to assess whether there is a signature of warming in the copepod community.
Nutrients have been measured at Australia’s long-term monitoring sites for up to 70 years. Under IMOS, the National Reference Stations have been extended to key regions around Australia (Lynch et al., 2014). Sampling and analysis methods have been standardised, with discrete samples collected throughout the water column using Niskin bottles, and measured using standard, segmented flow analysis with colorimetric detection (Rees et al., 2019).
The focus of the nutrient time series presented here are the specific forms of N, P and Si measured at the NRS—nitrate (NO3–), dissolved reactive phosphorus (DRP) and dissolved reactive silicon (DSi). Nutrient data are presented at each NRS, averaged in 10-m depth bins.
IMOS NRS
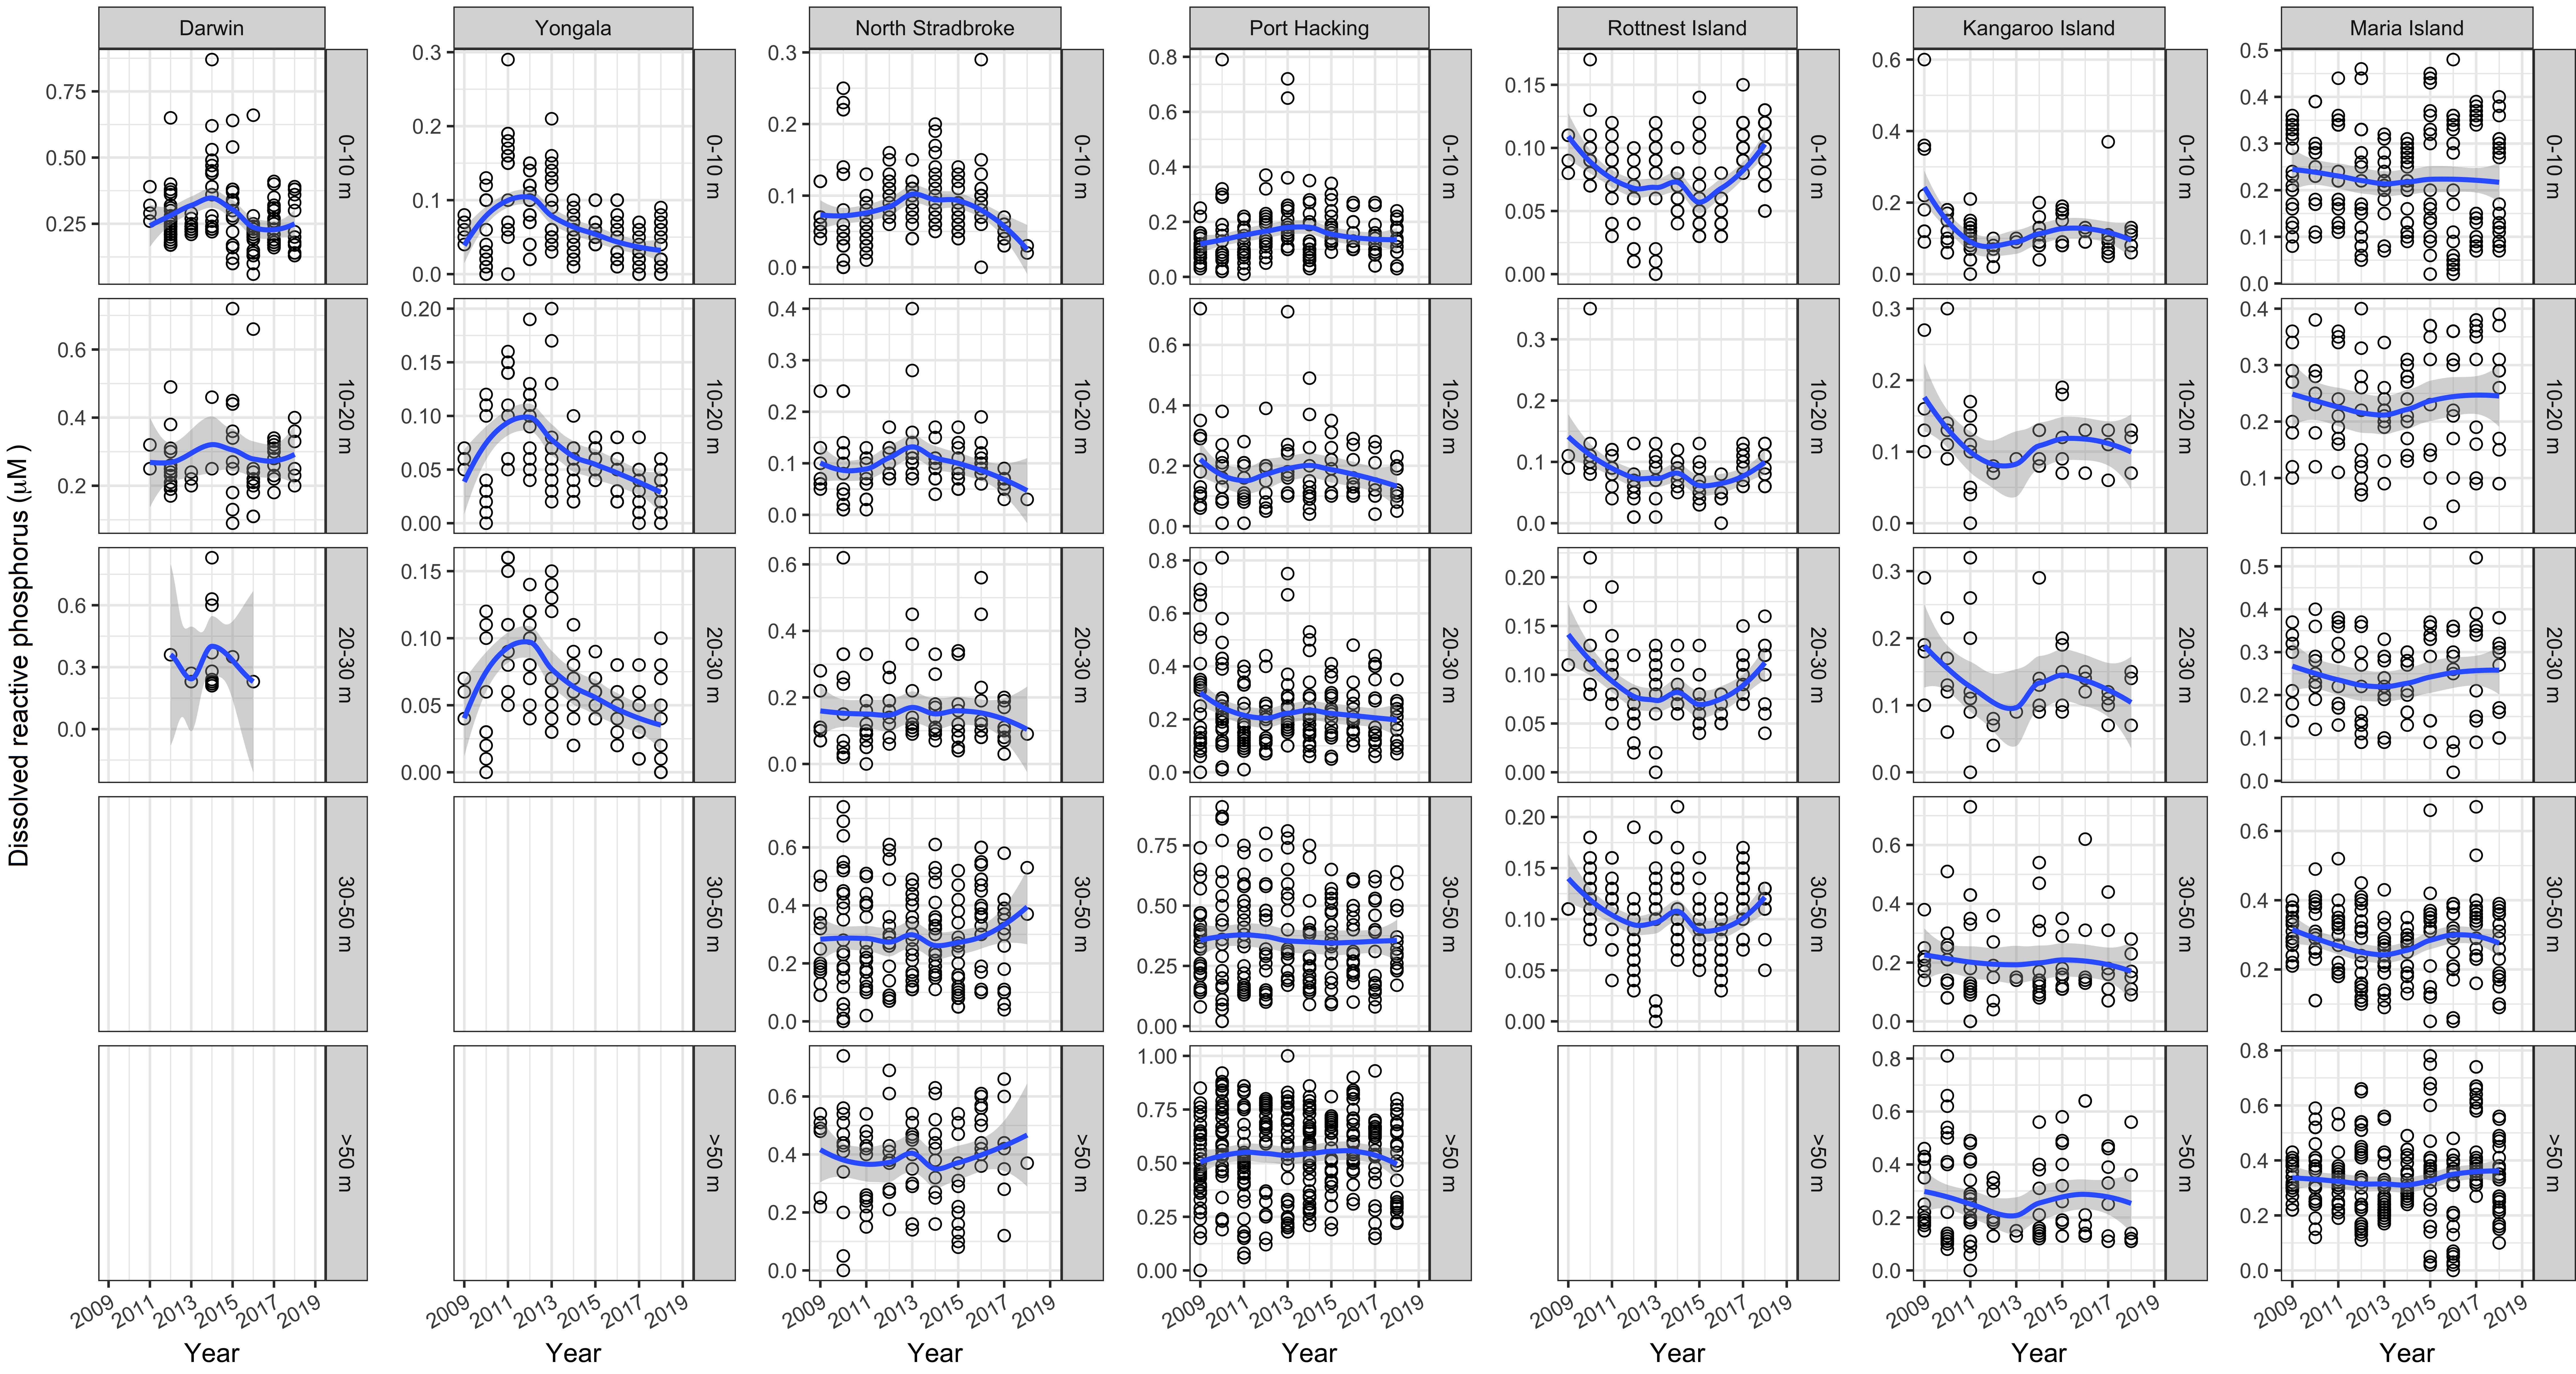
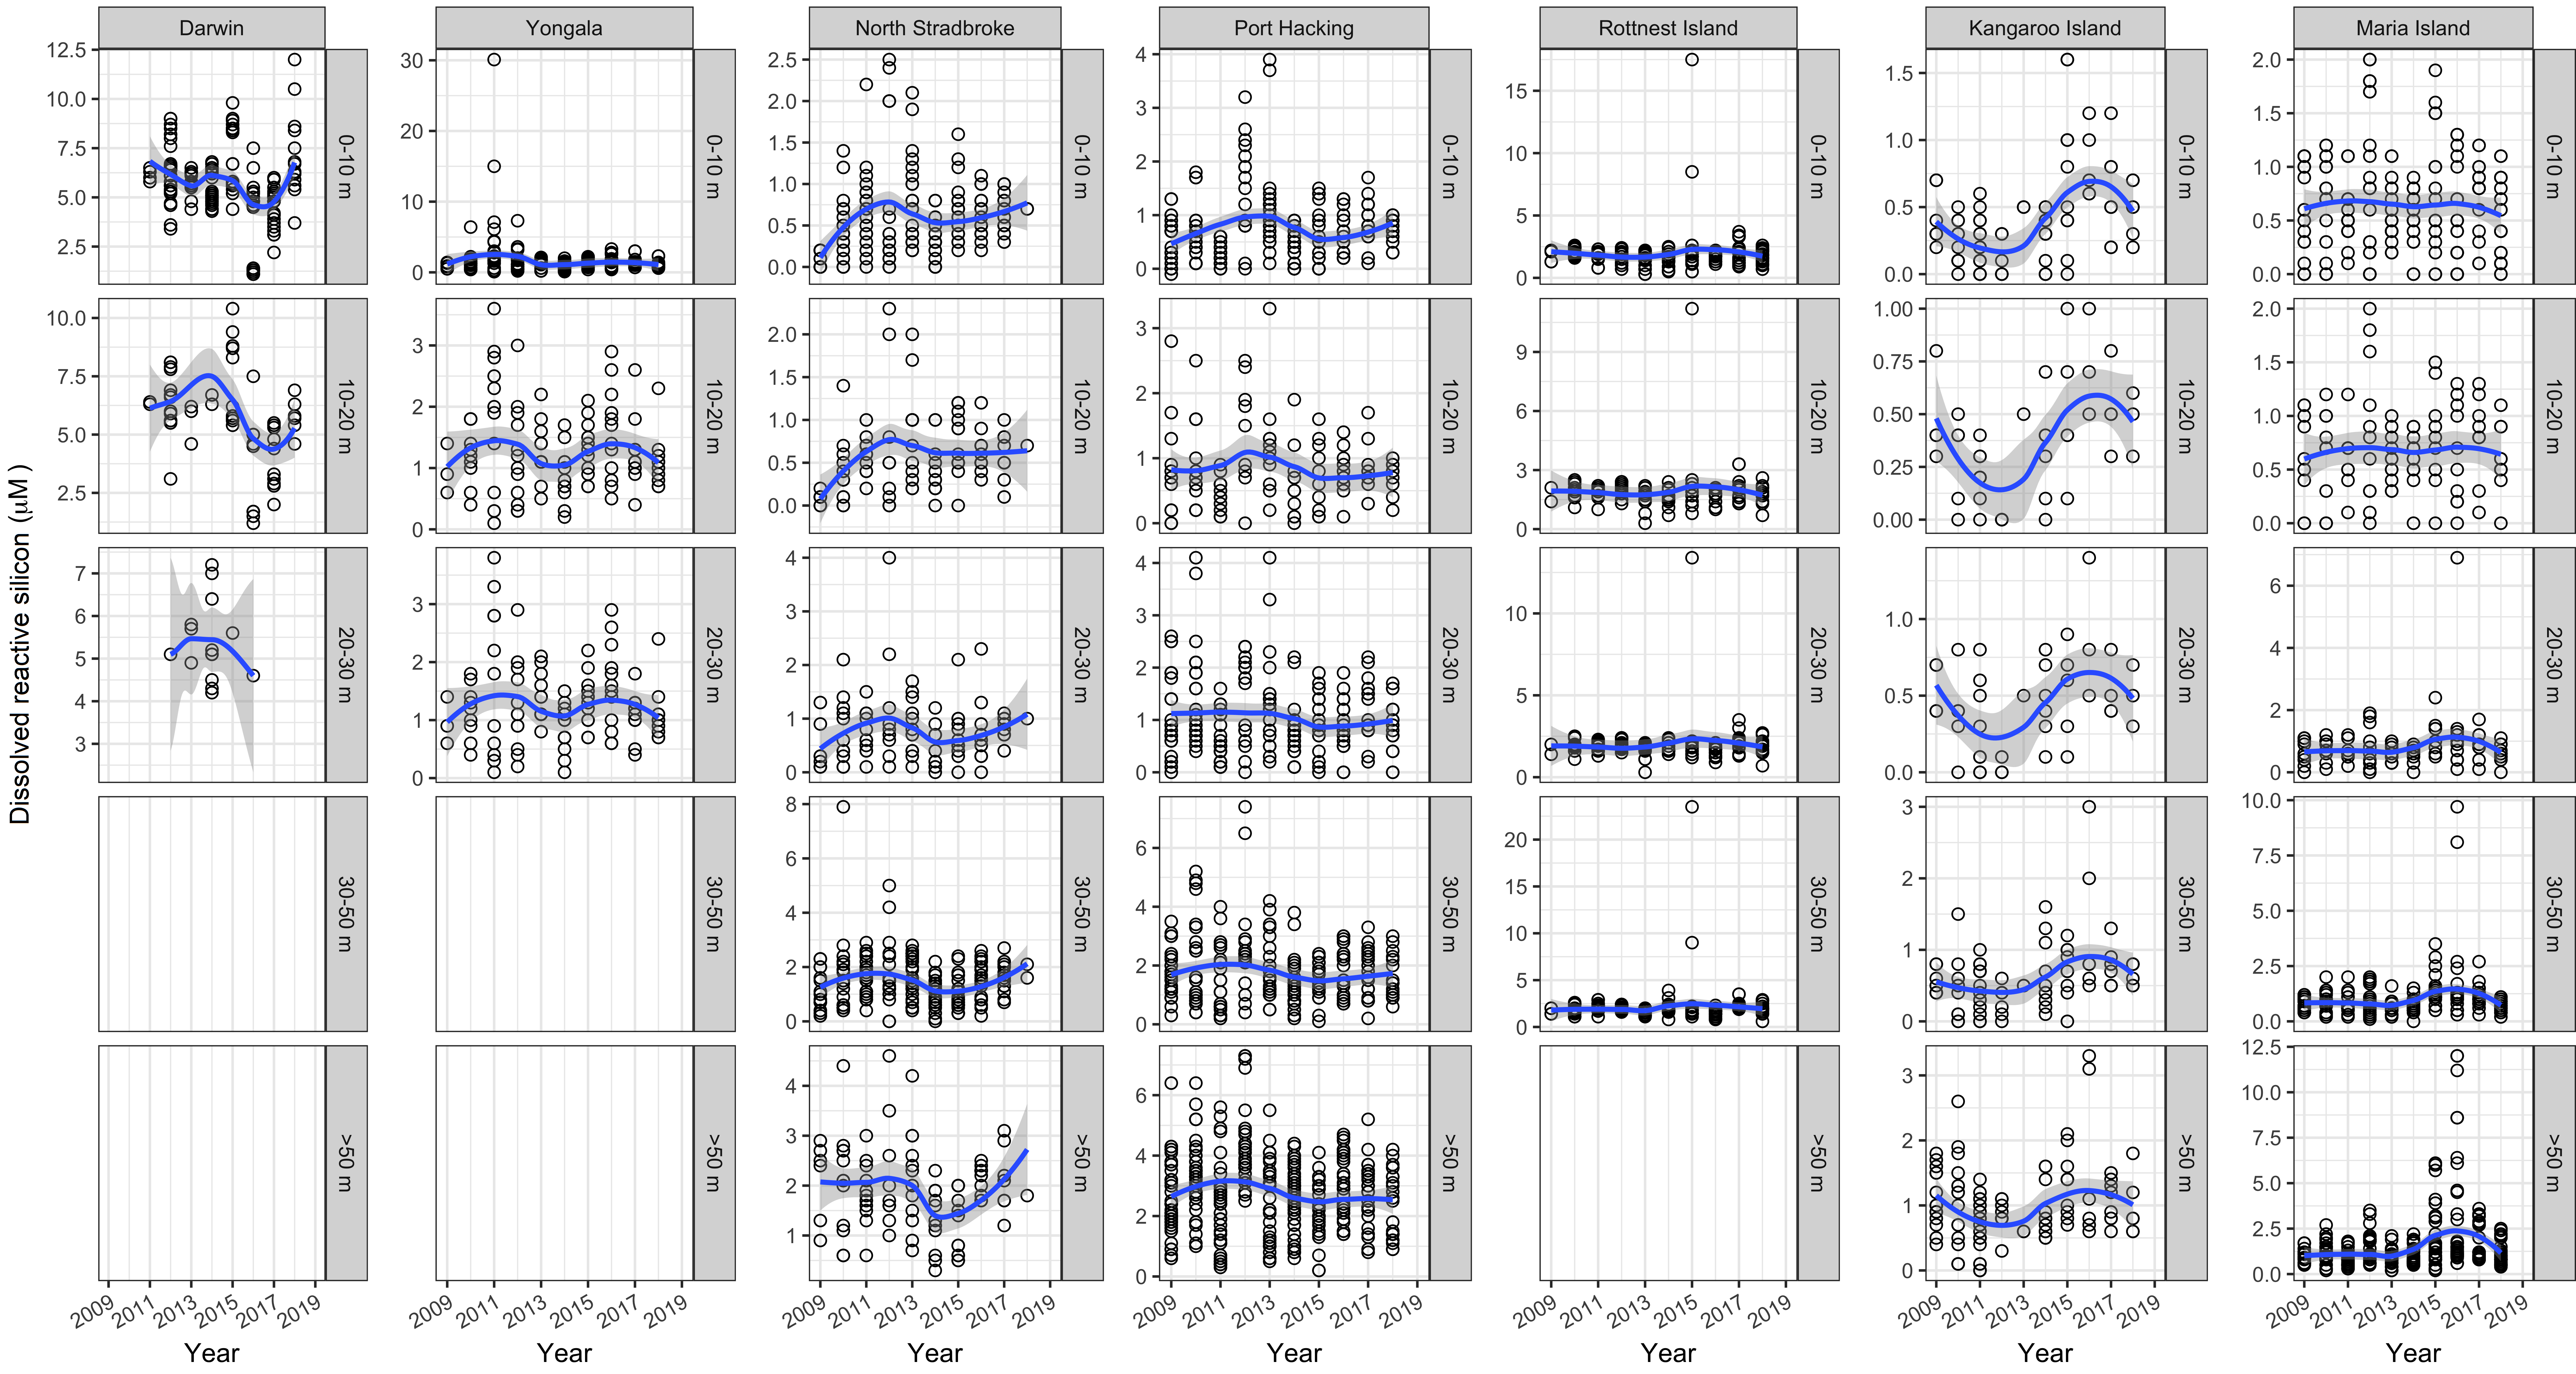
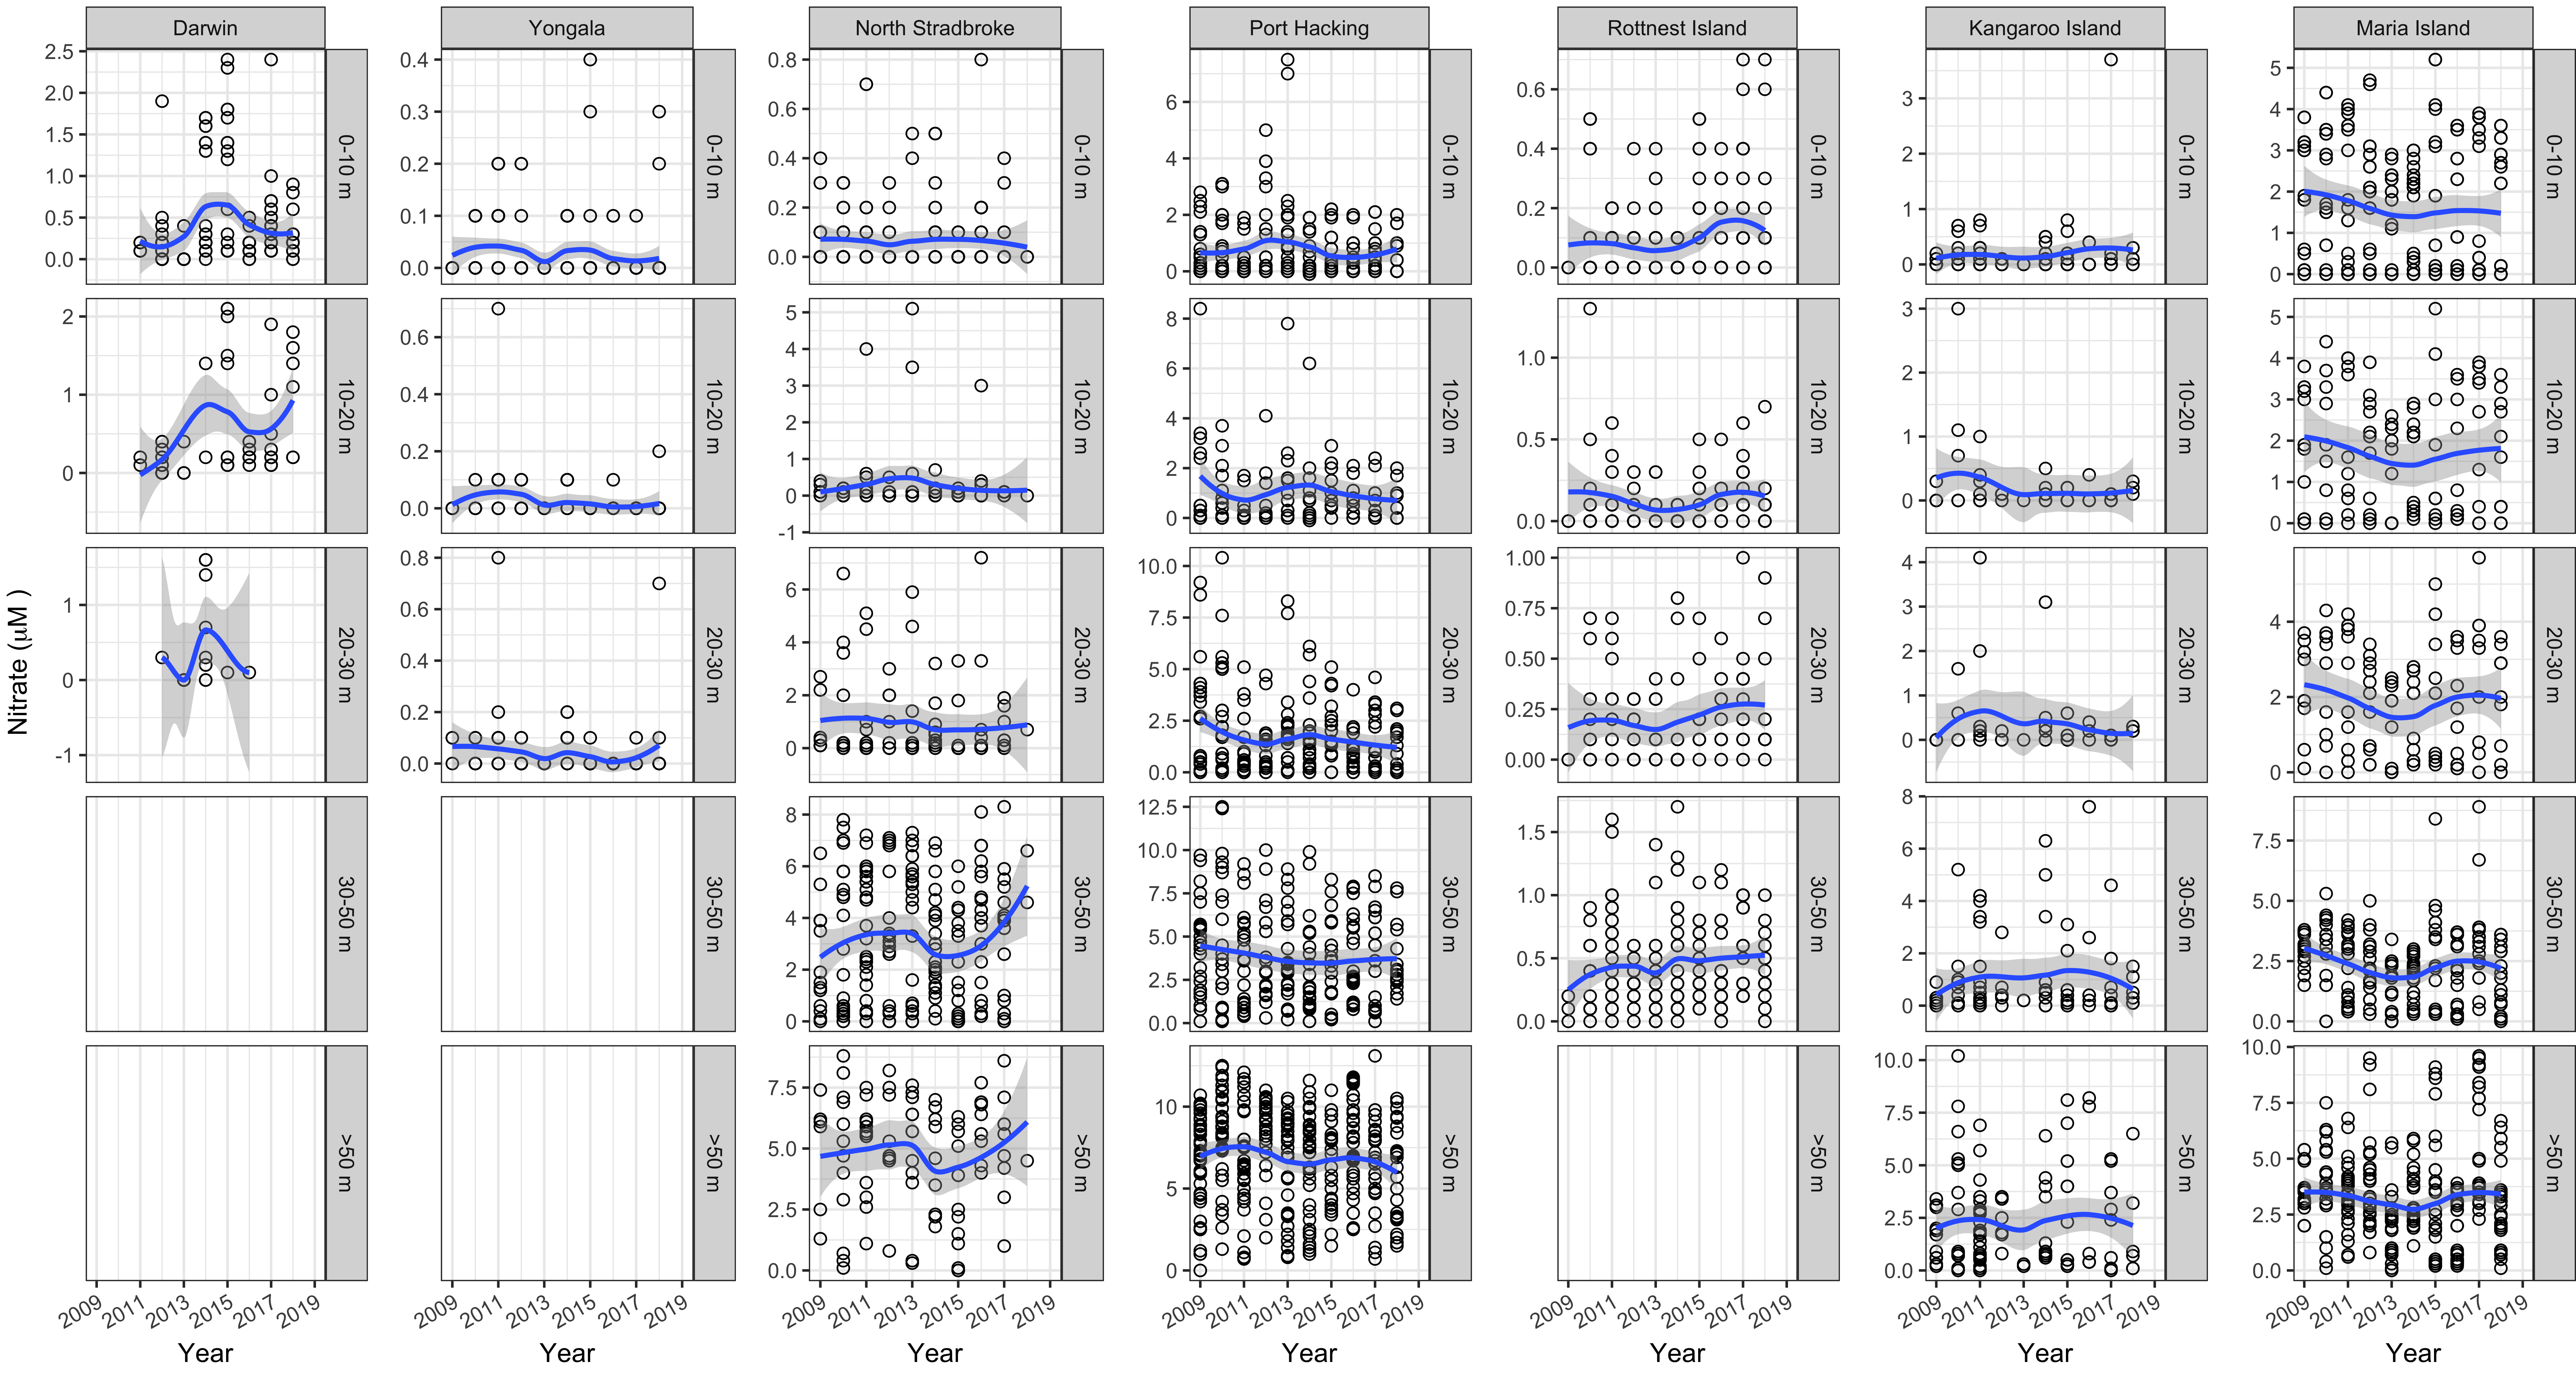
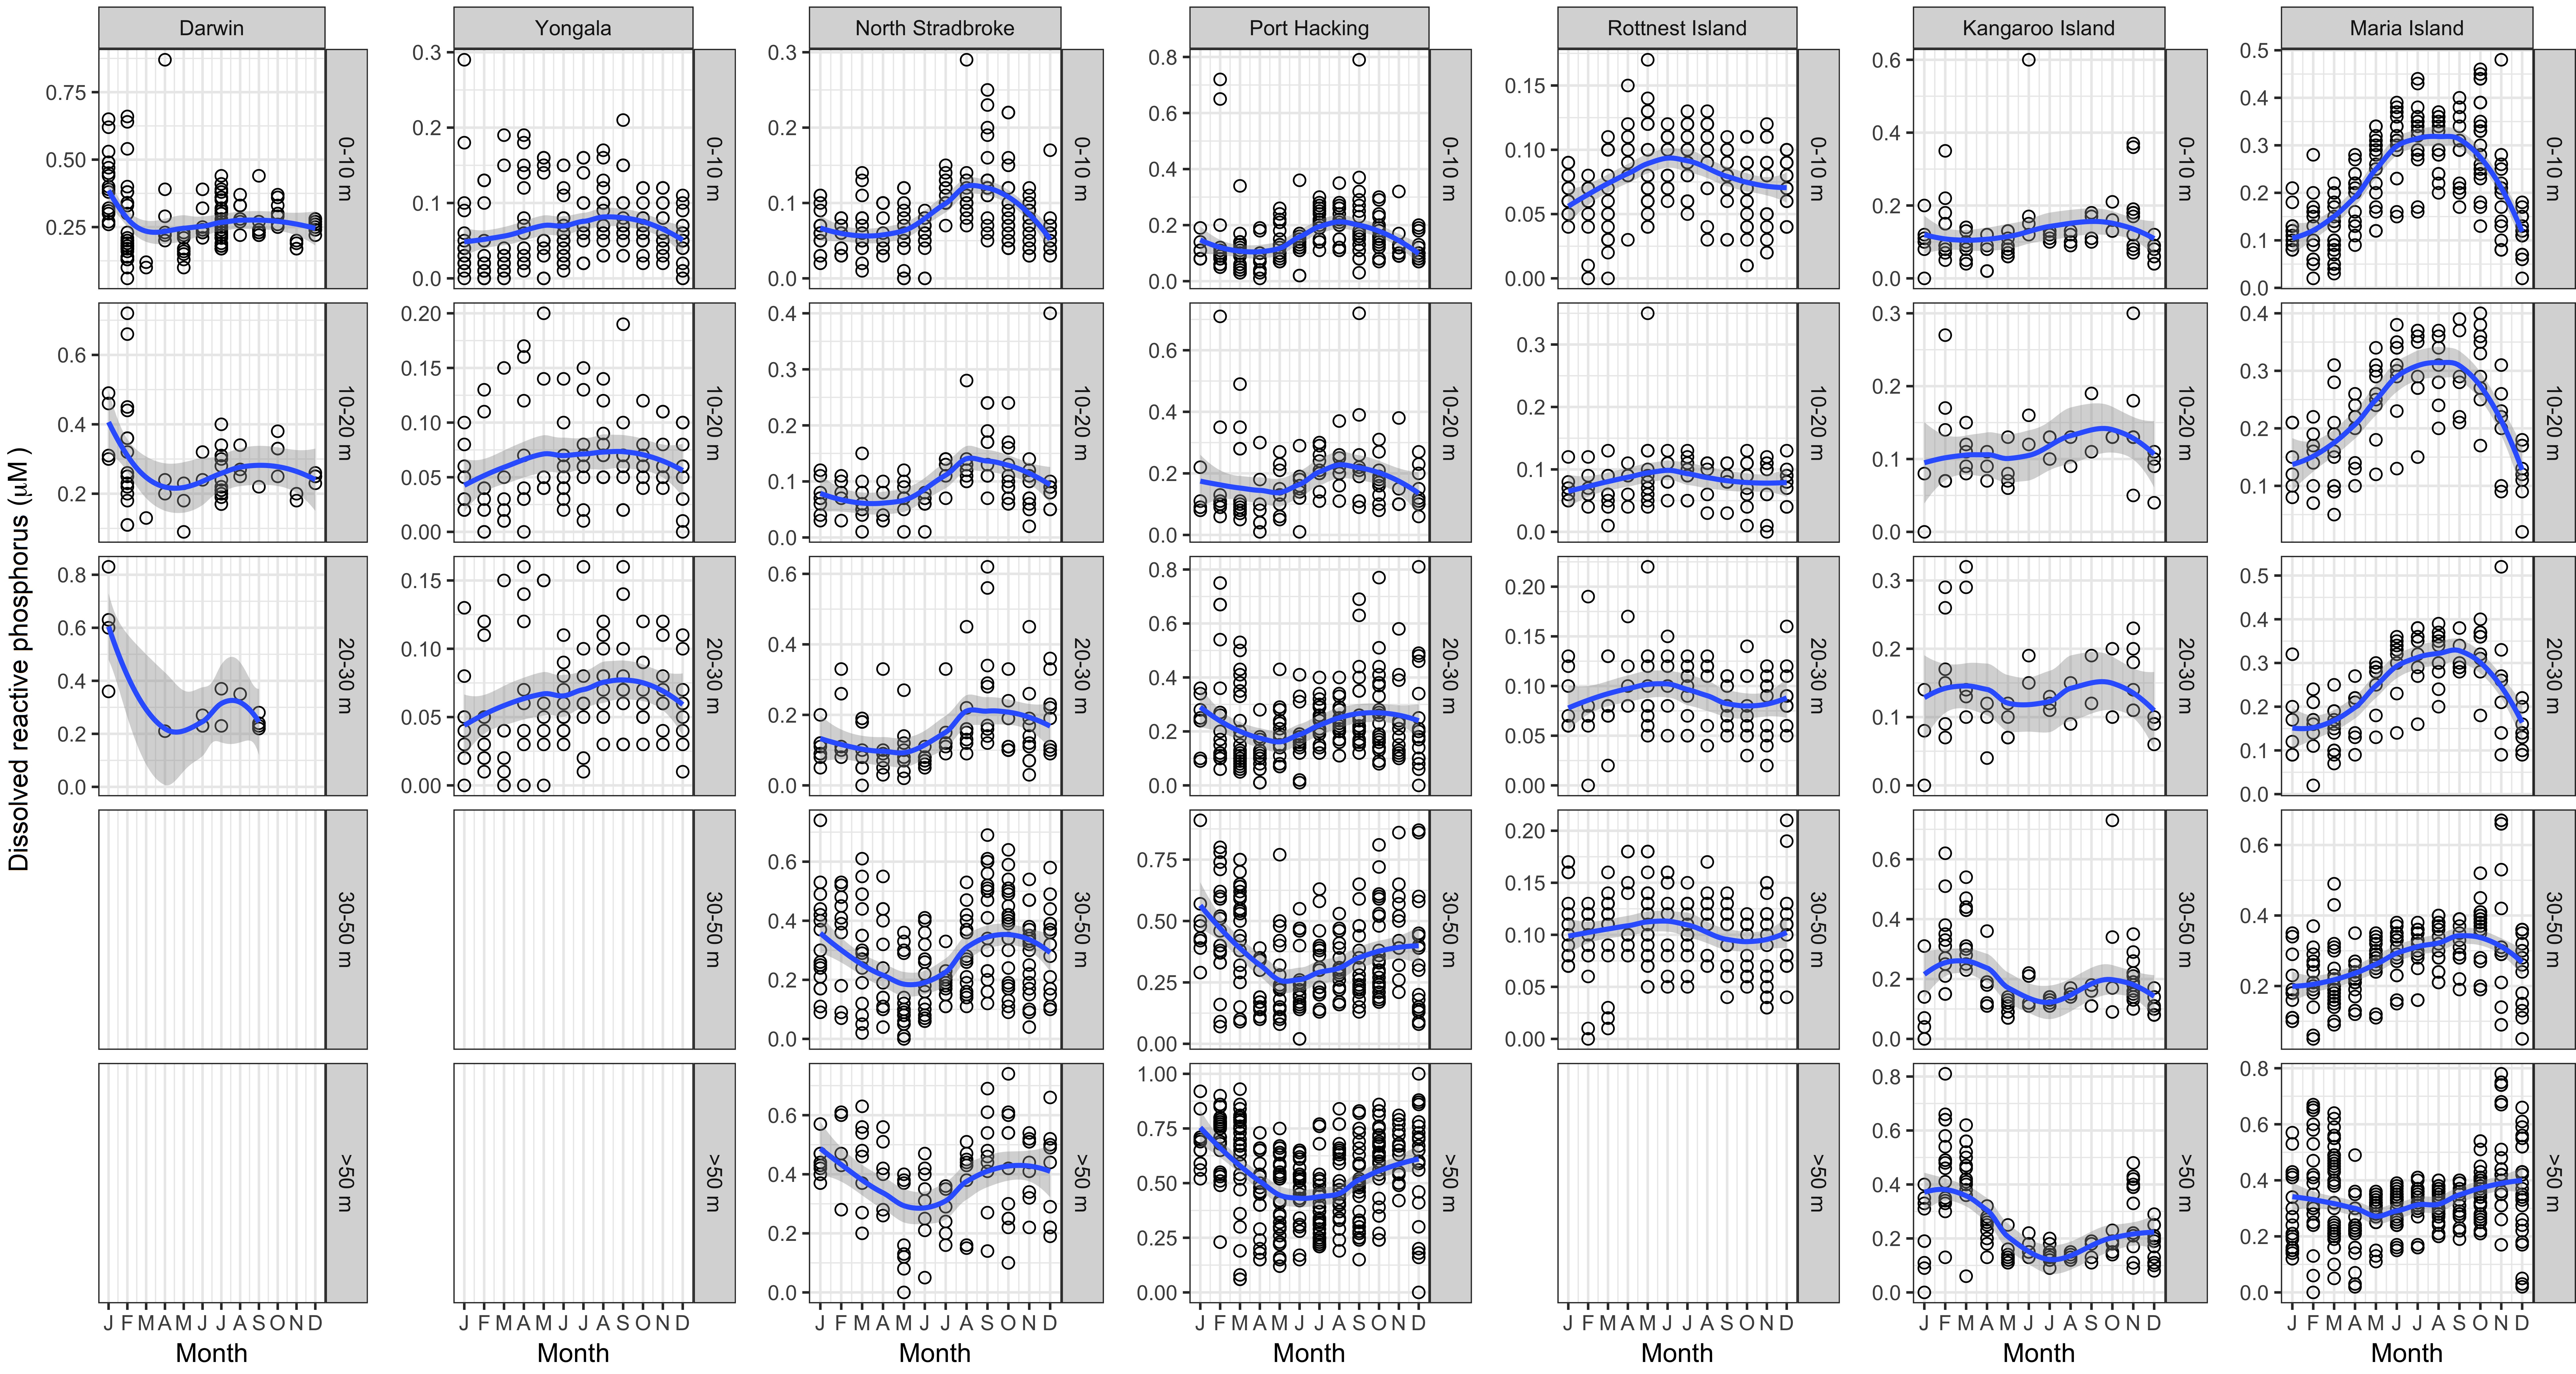
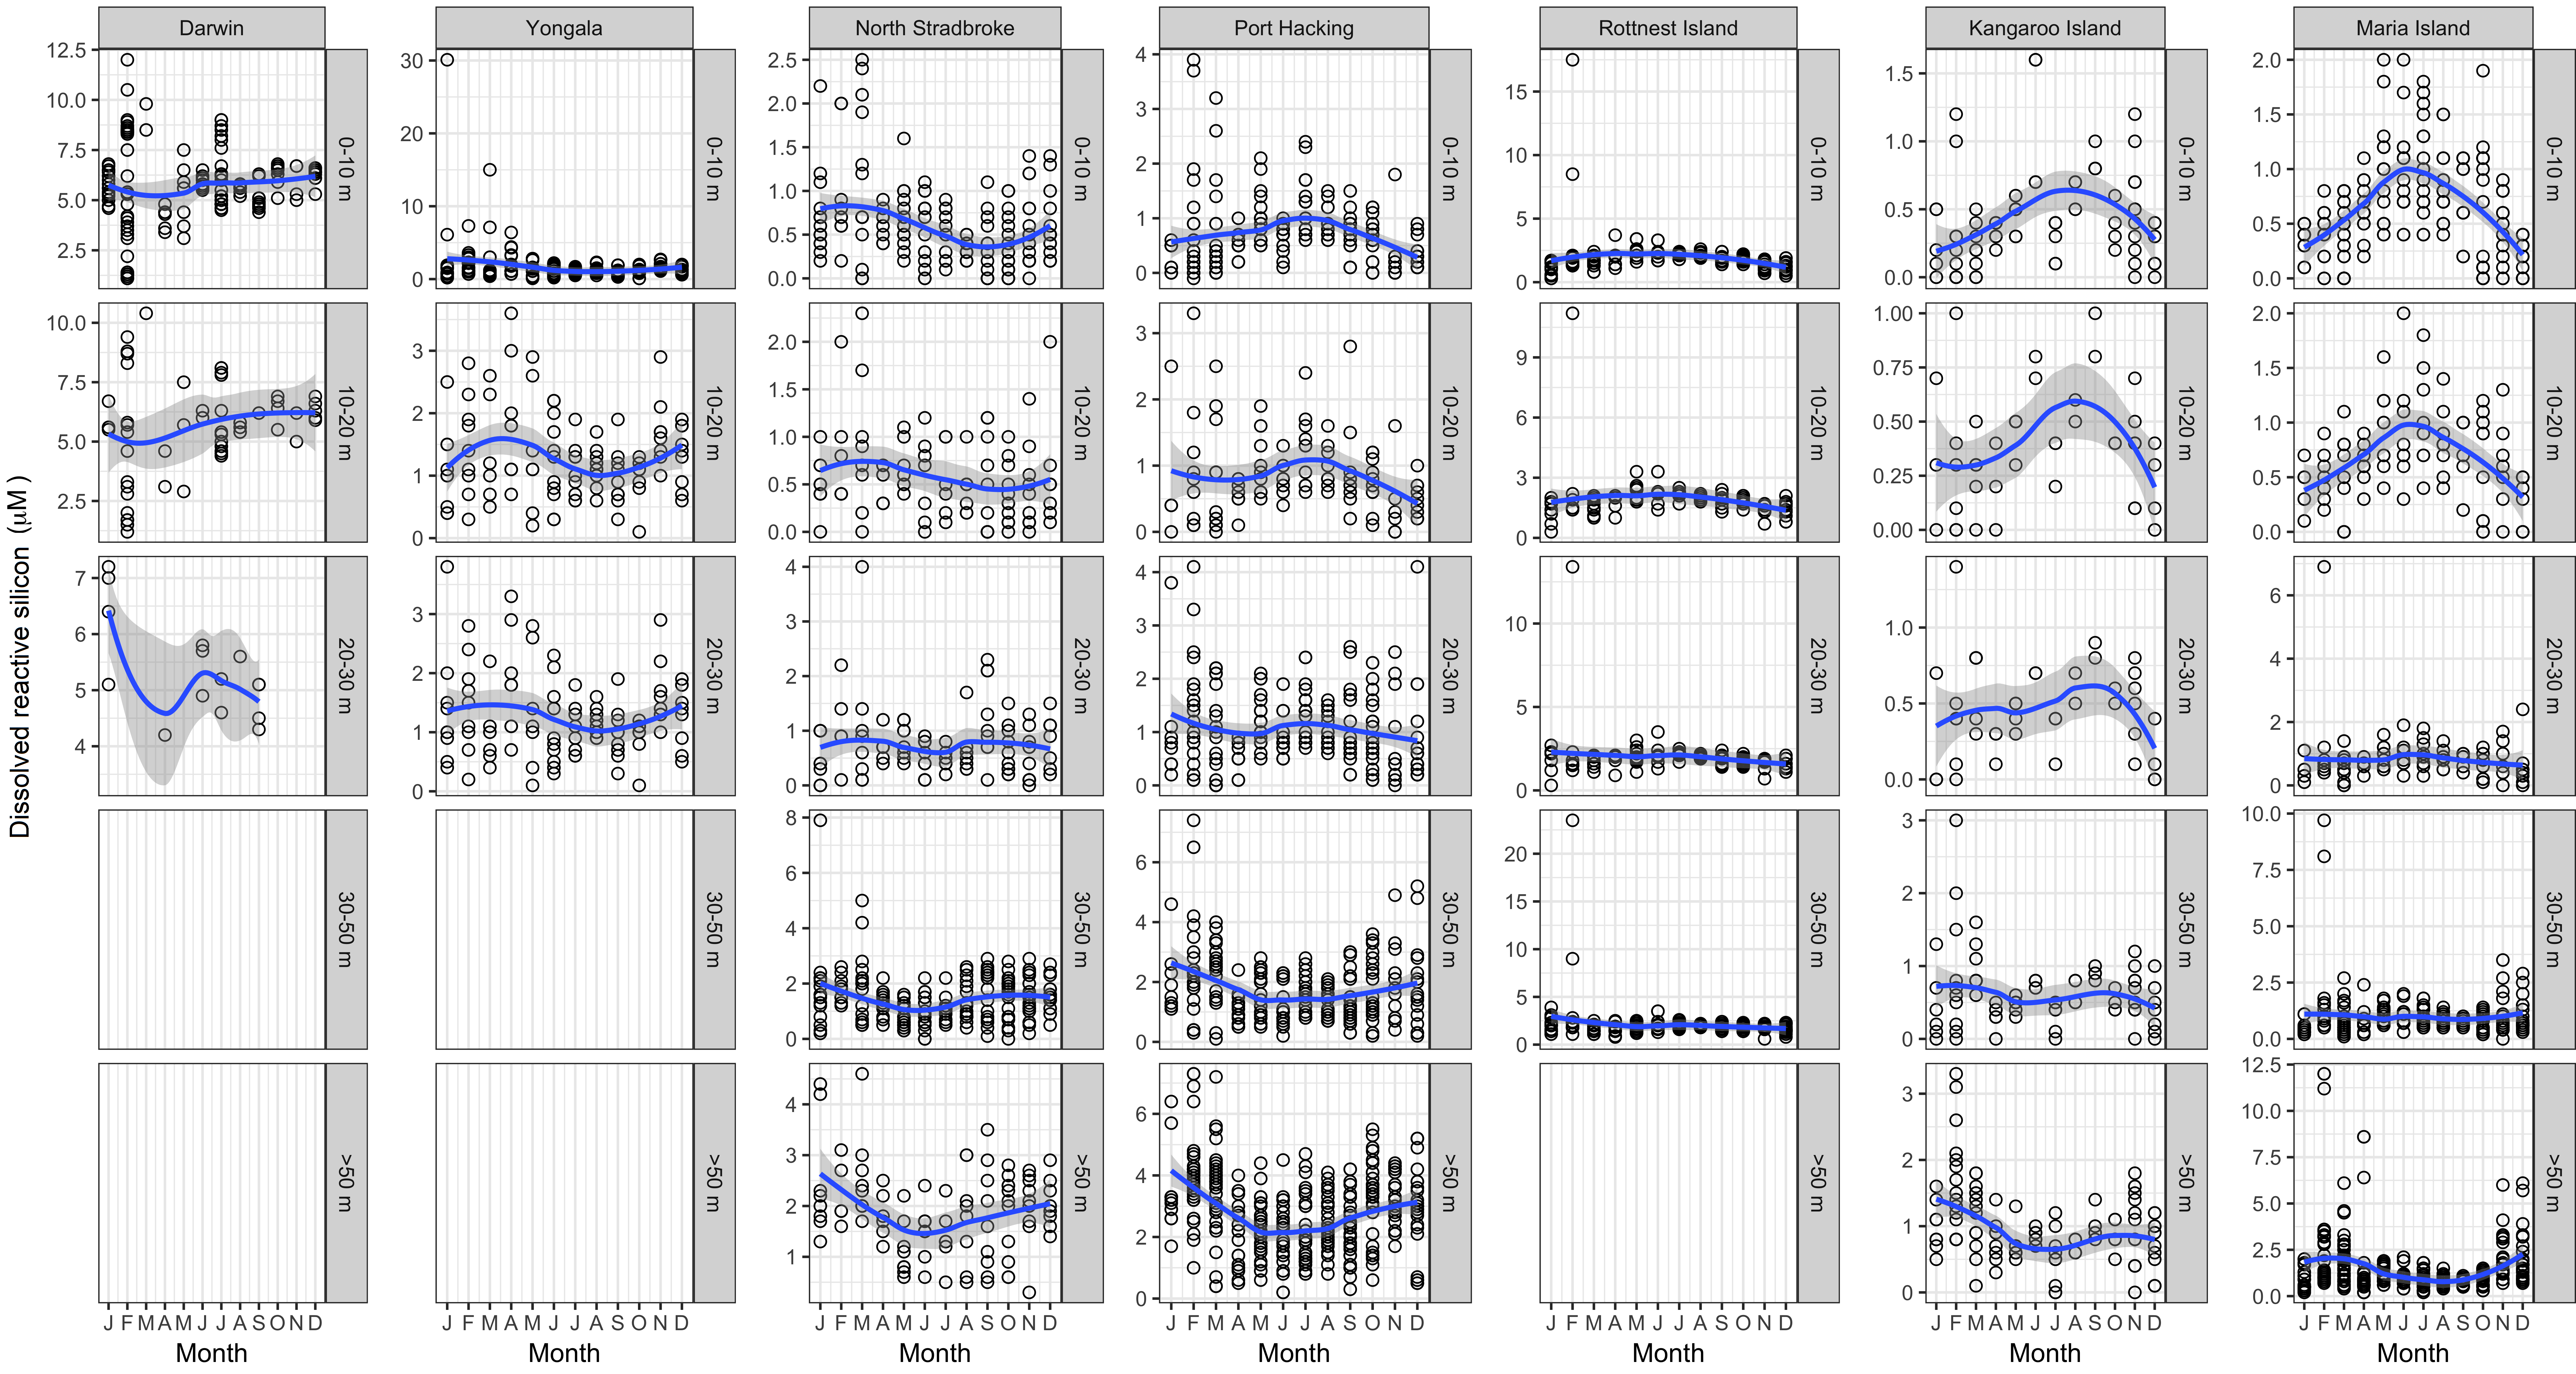
For the sub-set of nutrients presented, no trends were discernible at the Yongala (YON), North Stradbroke Island (NSI) and Kangaroo Island (KAI) NRS through 2010–2018, but some features are noteworthy. Peaks in DRP (Figure 1) and DSi (Figure 2) concentrations at Yongala in 2011 and 2012 likely resulted from widespread flooding or deepwater intrusion events caused by Tropical Cyclone Yasi (February 2011) and a deep tropical low (March 2012). NO3– did not respond similarly (Figure 3), either because its flood transport was lower, or it was rapidly used by the biota. Higher DSi concentrations at North Stradbroke Island in 2012 might also have resulted from local rivers flooding in March of that year. Kangaroo Island (KAI) had a broad peak in its time series for NO3–, DRP and DSi in 2015–17; it is most prominent for DSi throughout the water column, but is only clear for DRP and NO3– in deeper samples, and could align with a slight decline in salinity. The upwelling and enrichment mechanism described by van Ruth et al. (2018; Jan–Apr) might be responsible, but at other times of the year storm events causing intrusion of richer, lower salinity waters could have been active. Darwin showed no overall trend between 2011–2018 for NO3–, DRP and DSi, but all were higher in 2014 and 2015. Although this did not relate to overall wet-season rainfall, pulses of high nutrients were observed during the wet season when sampling coincided with spring tides and high rainfall events (within preceding 1–3 days). Seasonal cycles of nutrients are not discussed here, but have been included in supplementary information for reference.
Long-term stations
The full records of temperature and salinity at Maria Island, Port Hacking and Rottnest Island (see State and Trends of Australia's Ocean Report 1.1: Long-term changes in temperature around Australia) reveal long-term variability and changes in oceanographic conditions. In south-east Australia, over the past 70 years the EAC extension has transported more water characteristic of subtropical Australian waters to Tasmania (Maria Island). Whereas, off south-western Australia (Rottnest Island), the LC has waxed and waned under the influence of global climate drivers such as the El Niño-Southern Oscillation.
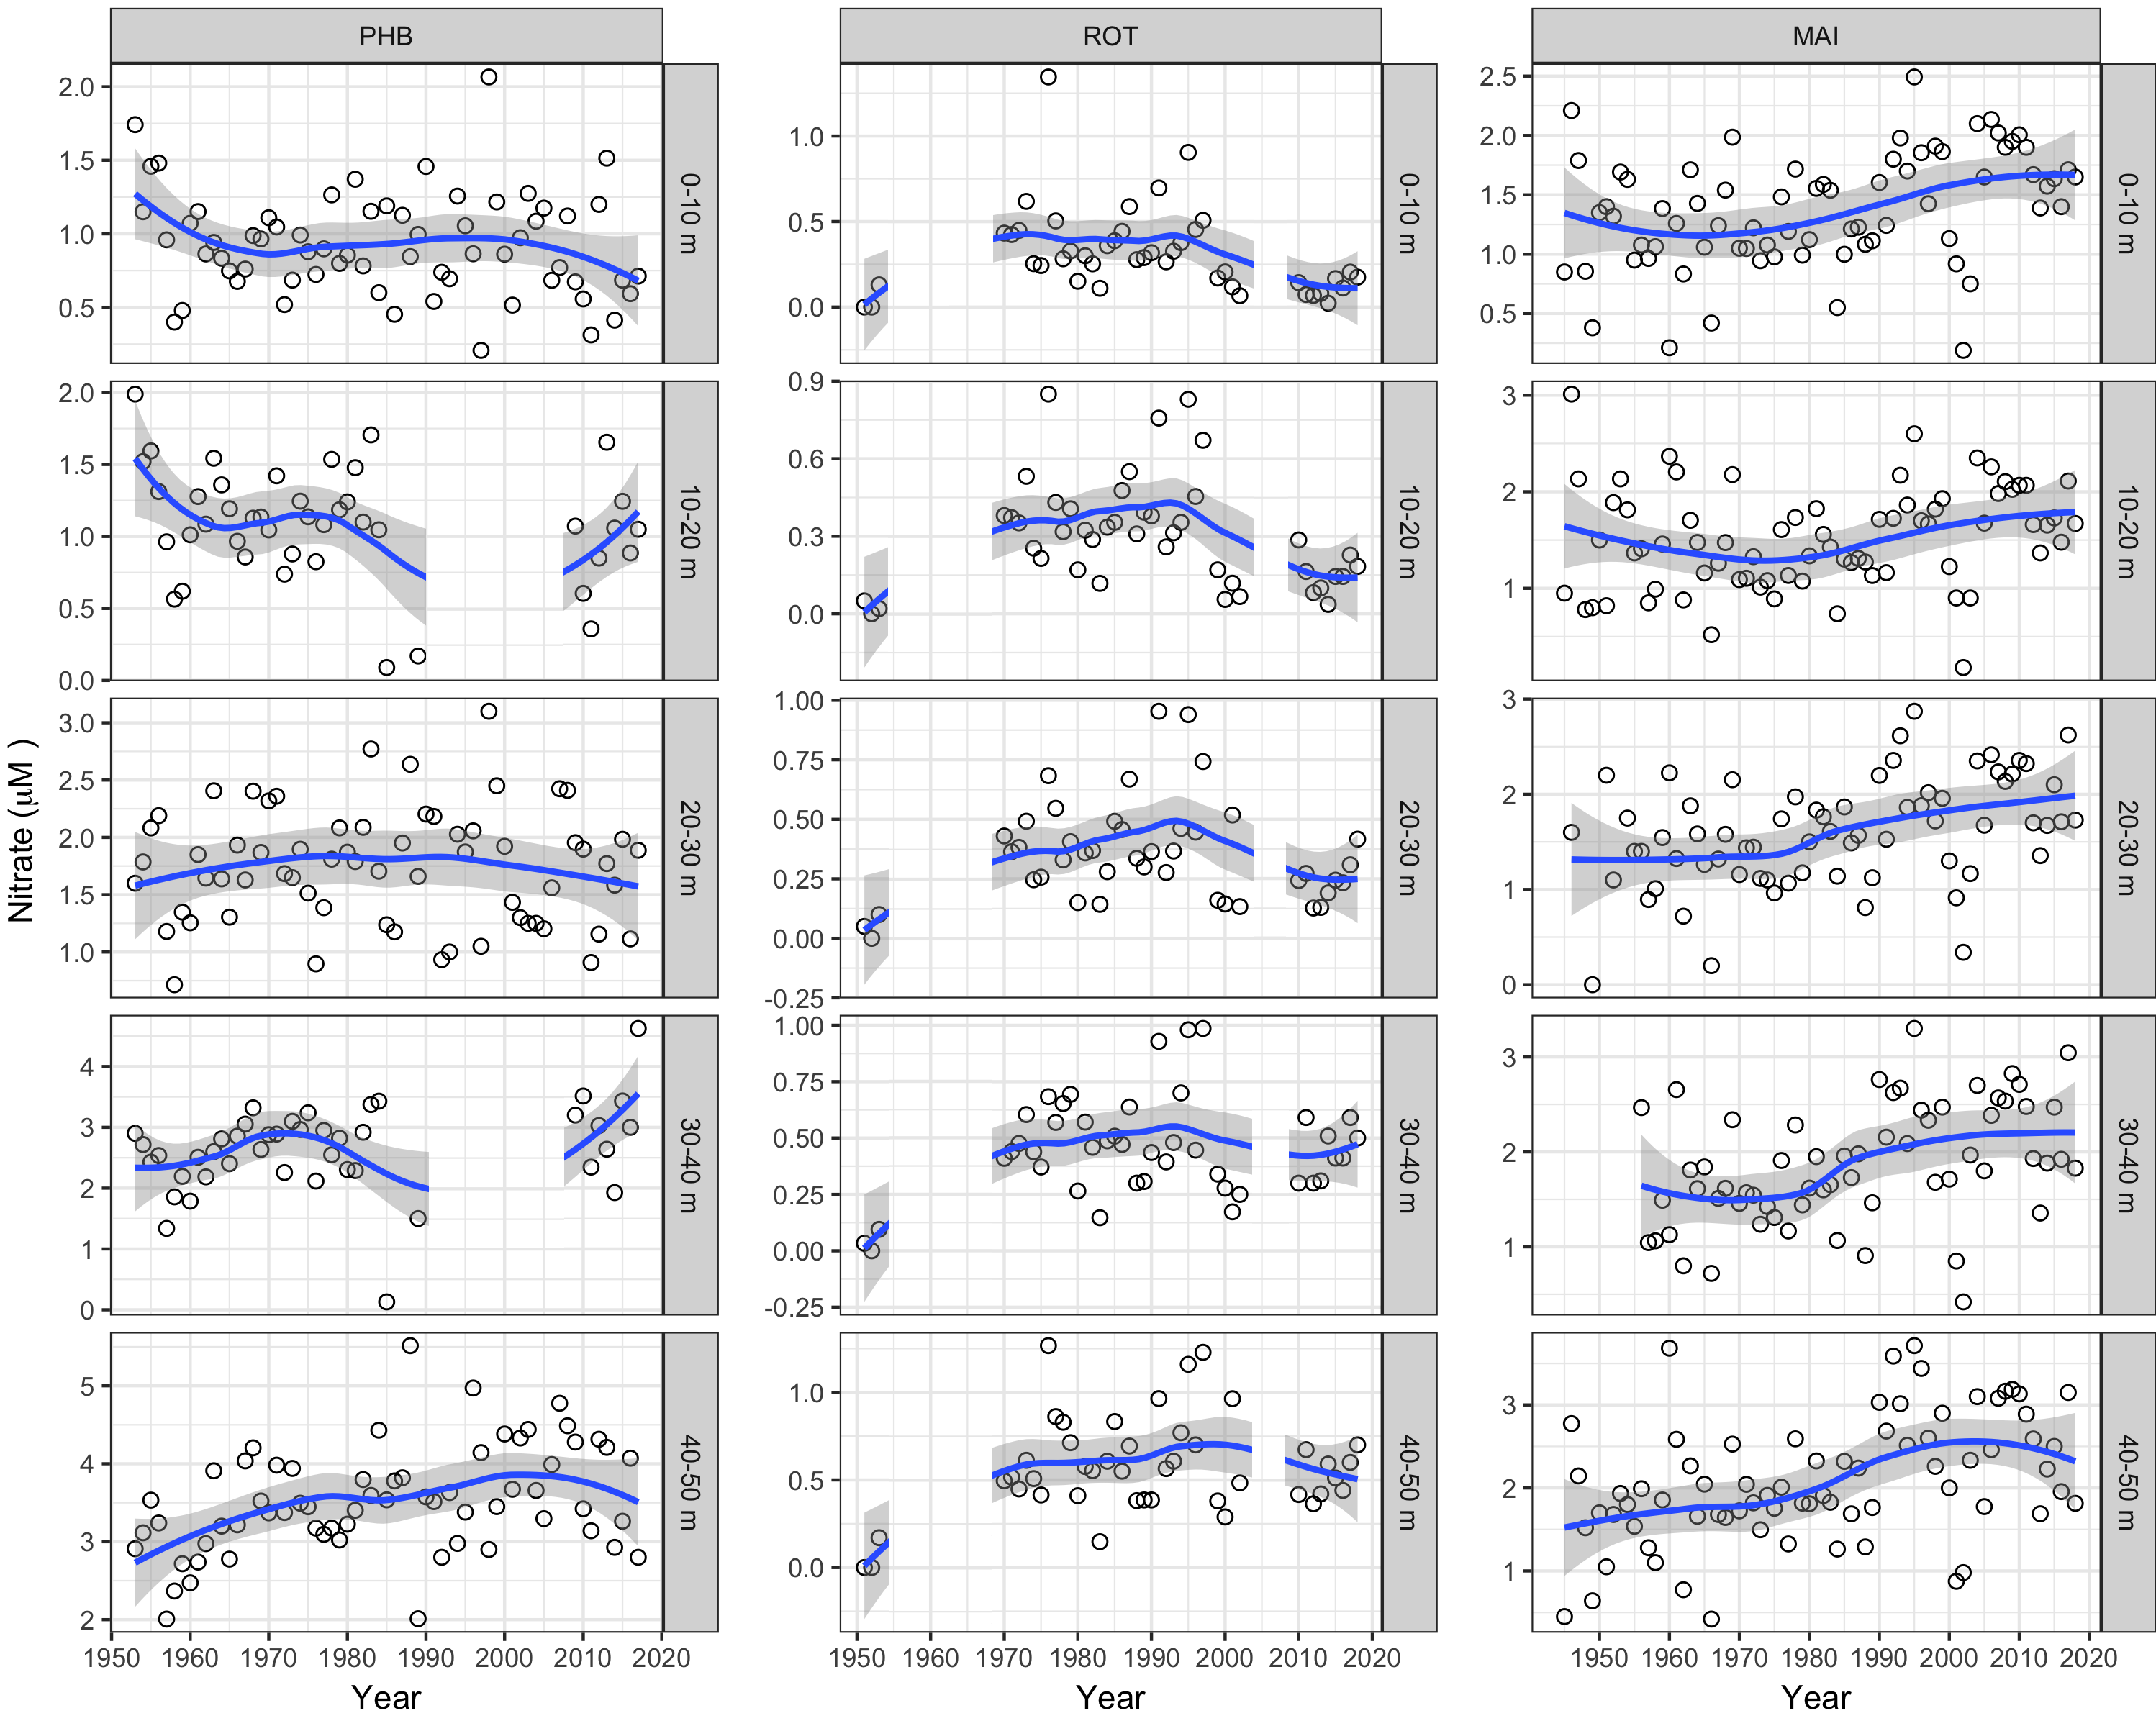
NO3– concentrations (Figure 4) in Maria Island surface waters look to have been rising from the 1970s with temperature and salinity. This is counter to their increased subtropical nature that would imply decreased NO3– levels. Instead, rising mean NO3– concentrations (now ~1.7 µM) suggest enhanced replenishment over time with winter mixing and incursion of sub-Antarctic surface waters, the latter supported by seasonally declining salinity at Maria Island—autumn to early spring—for all sampled depths (related to higher nutrient levels, see Harris et al. (1987) . Over 70 years, NO3– levels at the surface at Port Hacking (100-m station, off Sydney) have declined from 1.25 to 0.75 µM, but increased at 40–50 m depth, which could be linked with increased stratification. While the Rottnest Island NO3– record shows no long-term trend, a broad peak (0.30–0.50 µM) from 1975 to 1995 suggests a period of diminished LC influence. At 40–50 m depth, all three stations show a similar NO3– time series; which might reflect a region-wide oceanographic influence.
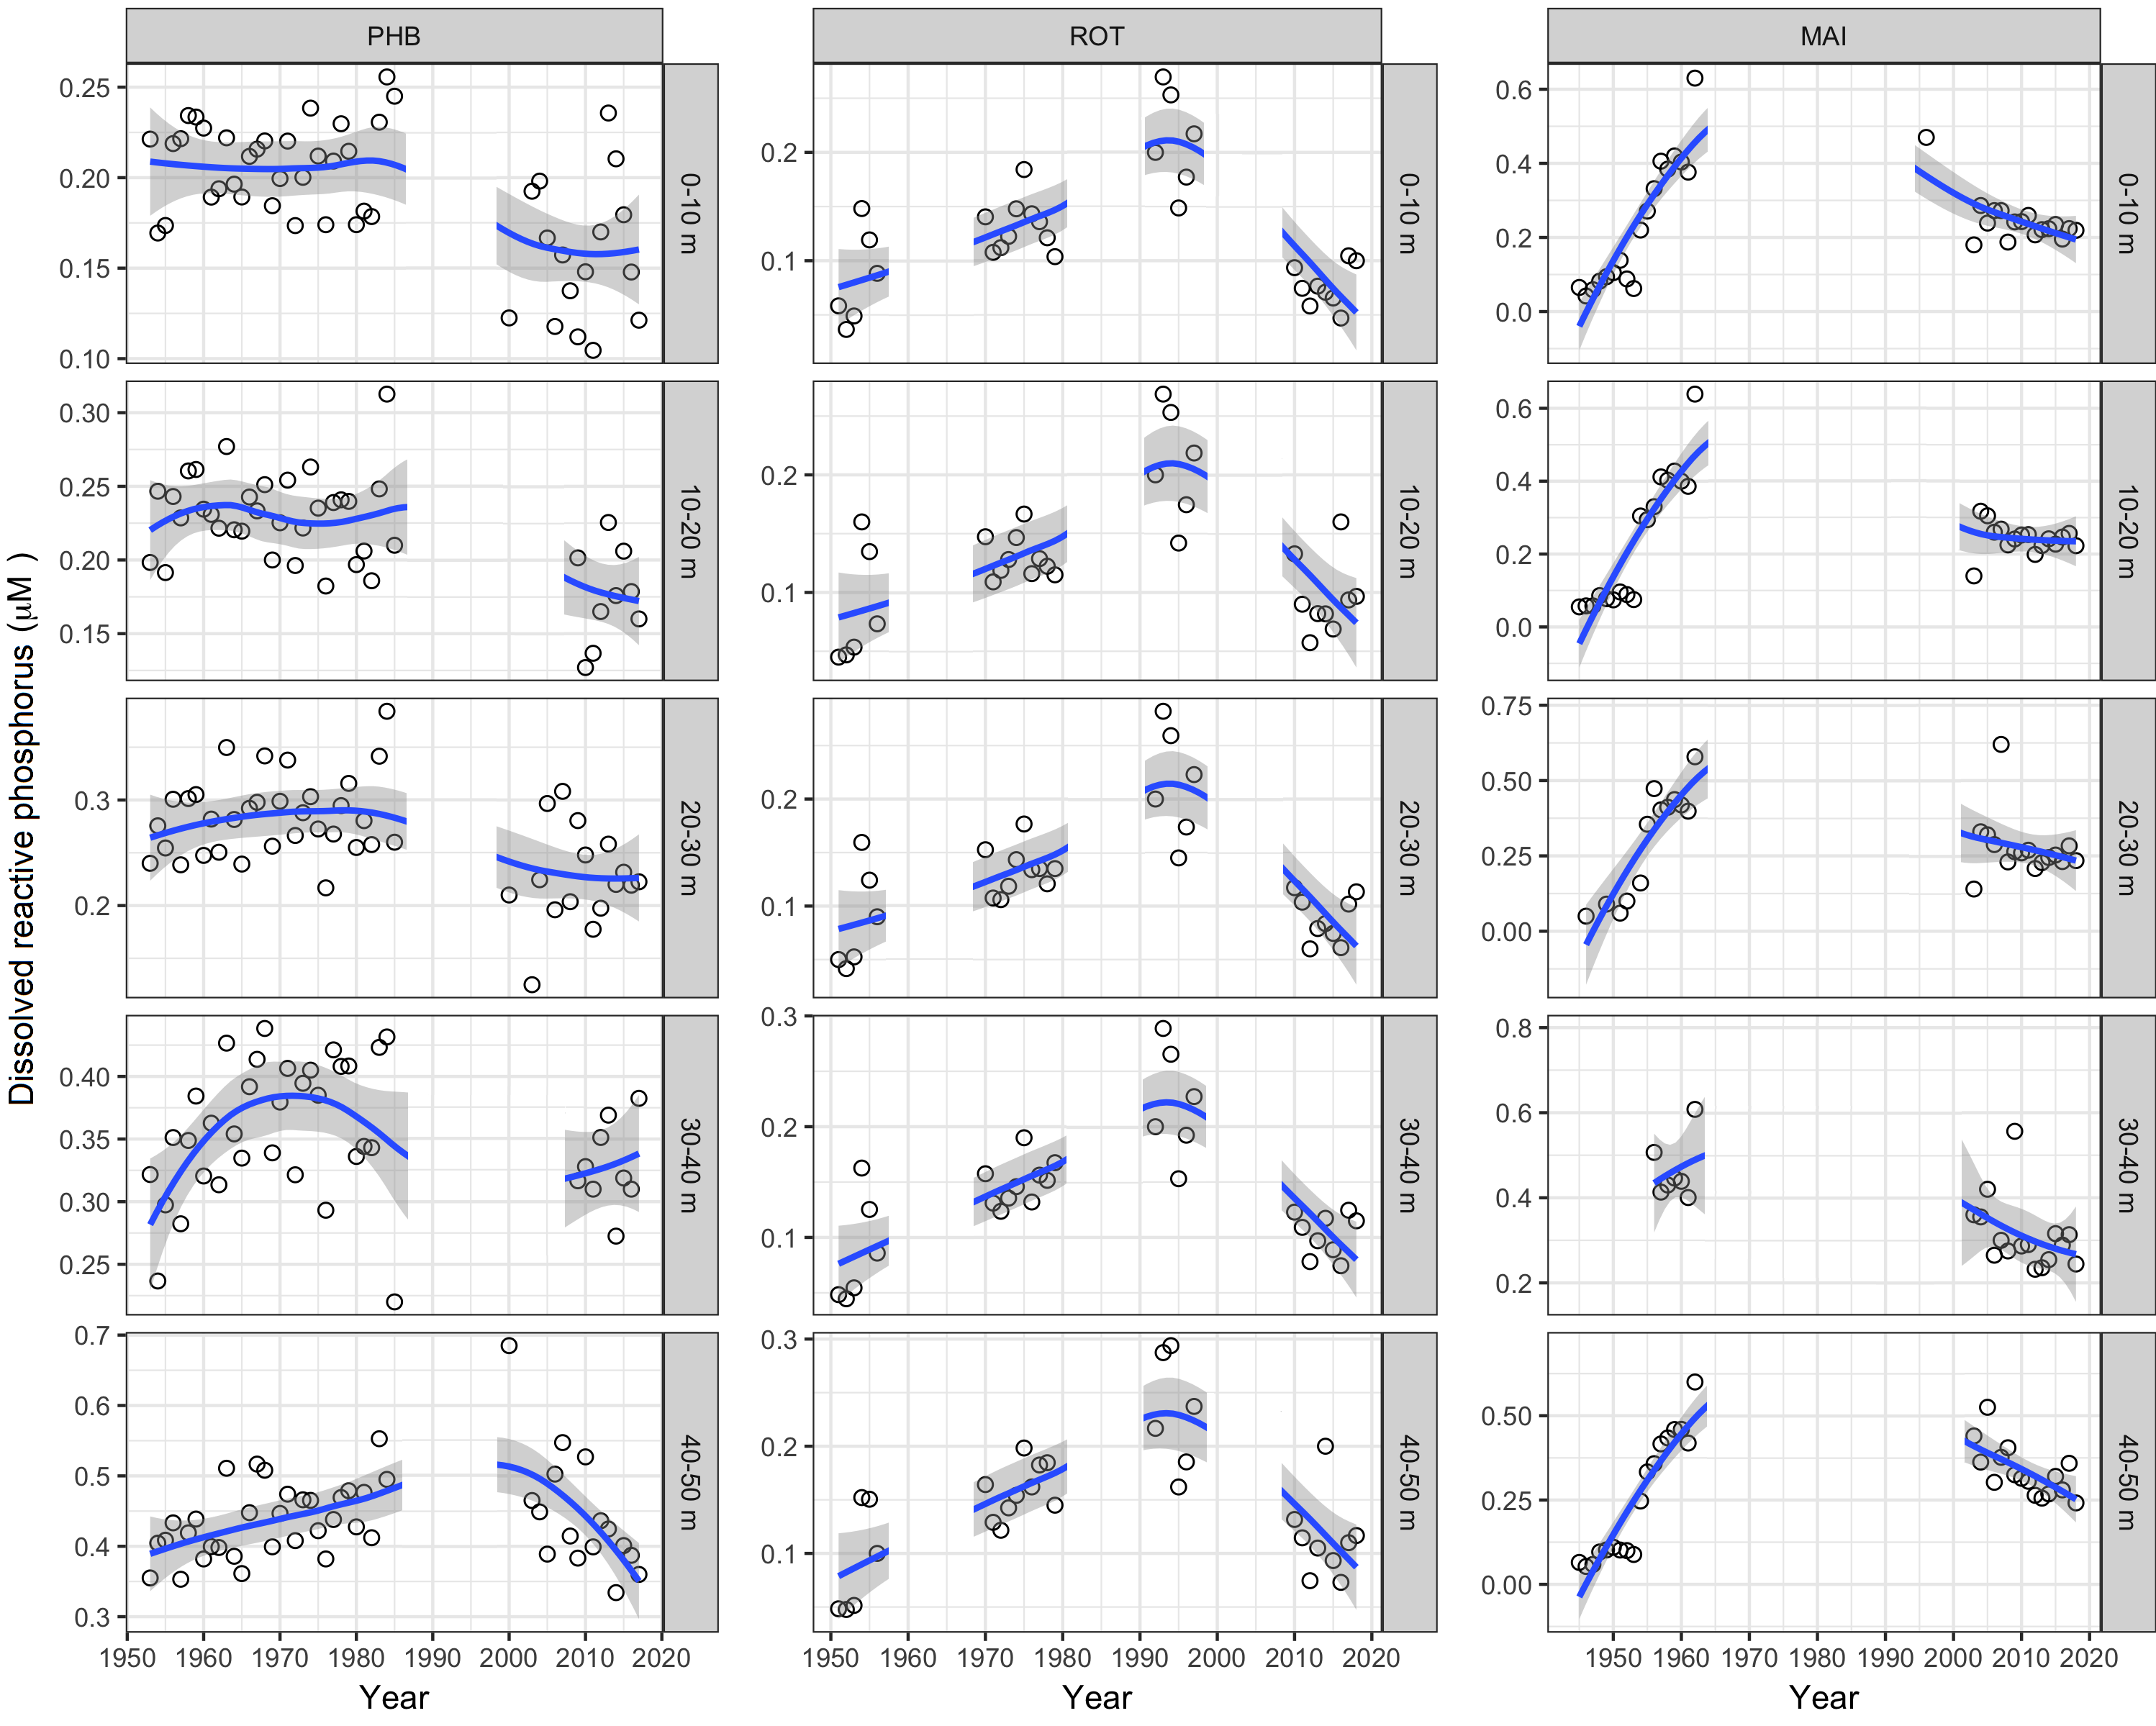
DRP concentrations (Figure 5) show different behaviour interannually to NO3–, which could arise from differences in their supply and assimilation with fluctuating composition of the phytoplankton community. Interpretation of the DRP time series is constrained by data gaps. Maria and Rottnest Islands have similar trends over the full depth range: an initial rise to a peak and a decline to the present. The peak for Maria Island (~0.55 mM at the surface) was in the 1970s; that for Rottnest Island (~0.20 µM at the surface) in the early 1990s. Port Hacking appears to have declined in DRP concentration from a plateau in the mid-1950s to mid-1980s until the last decade (0.20–0.15 mM at the surface). Similar profiles for all three stations are seen at depth (40–50 m) for DRP, as also noted above for NO3–.
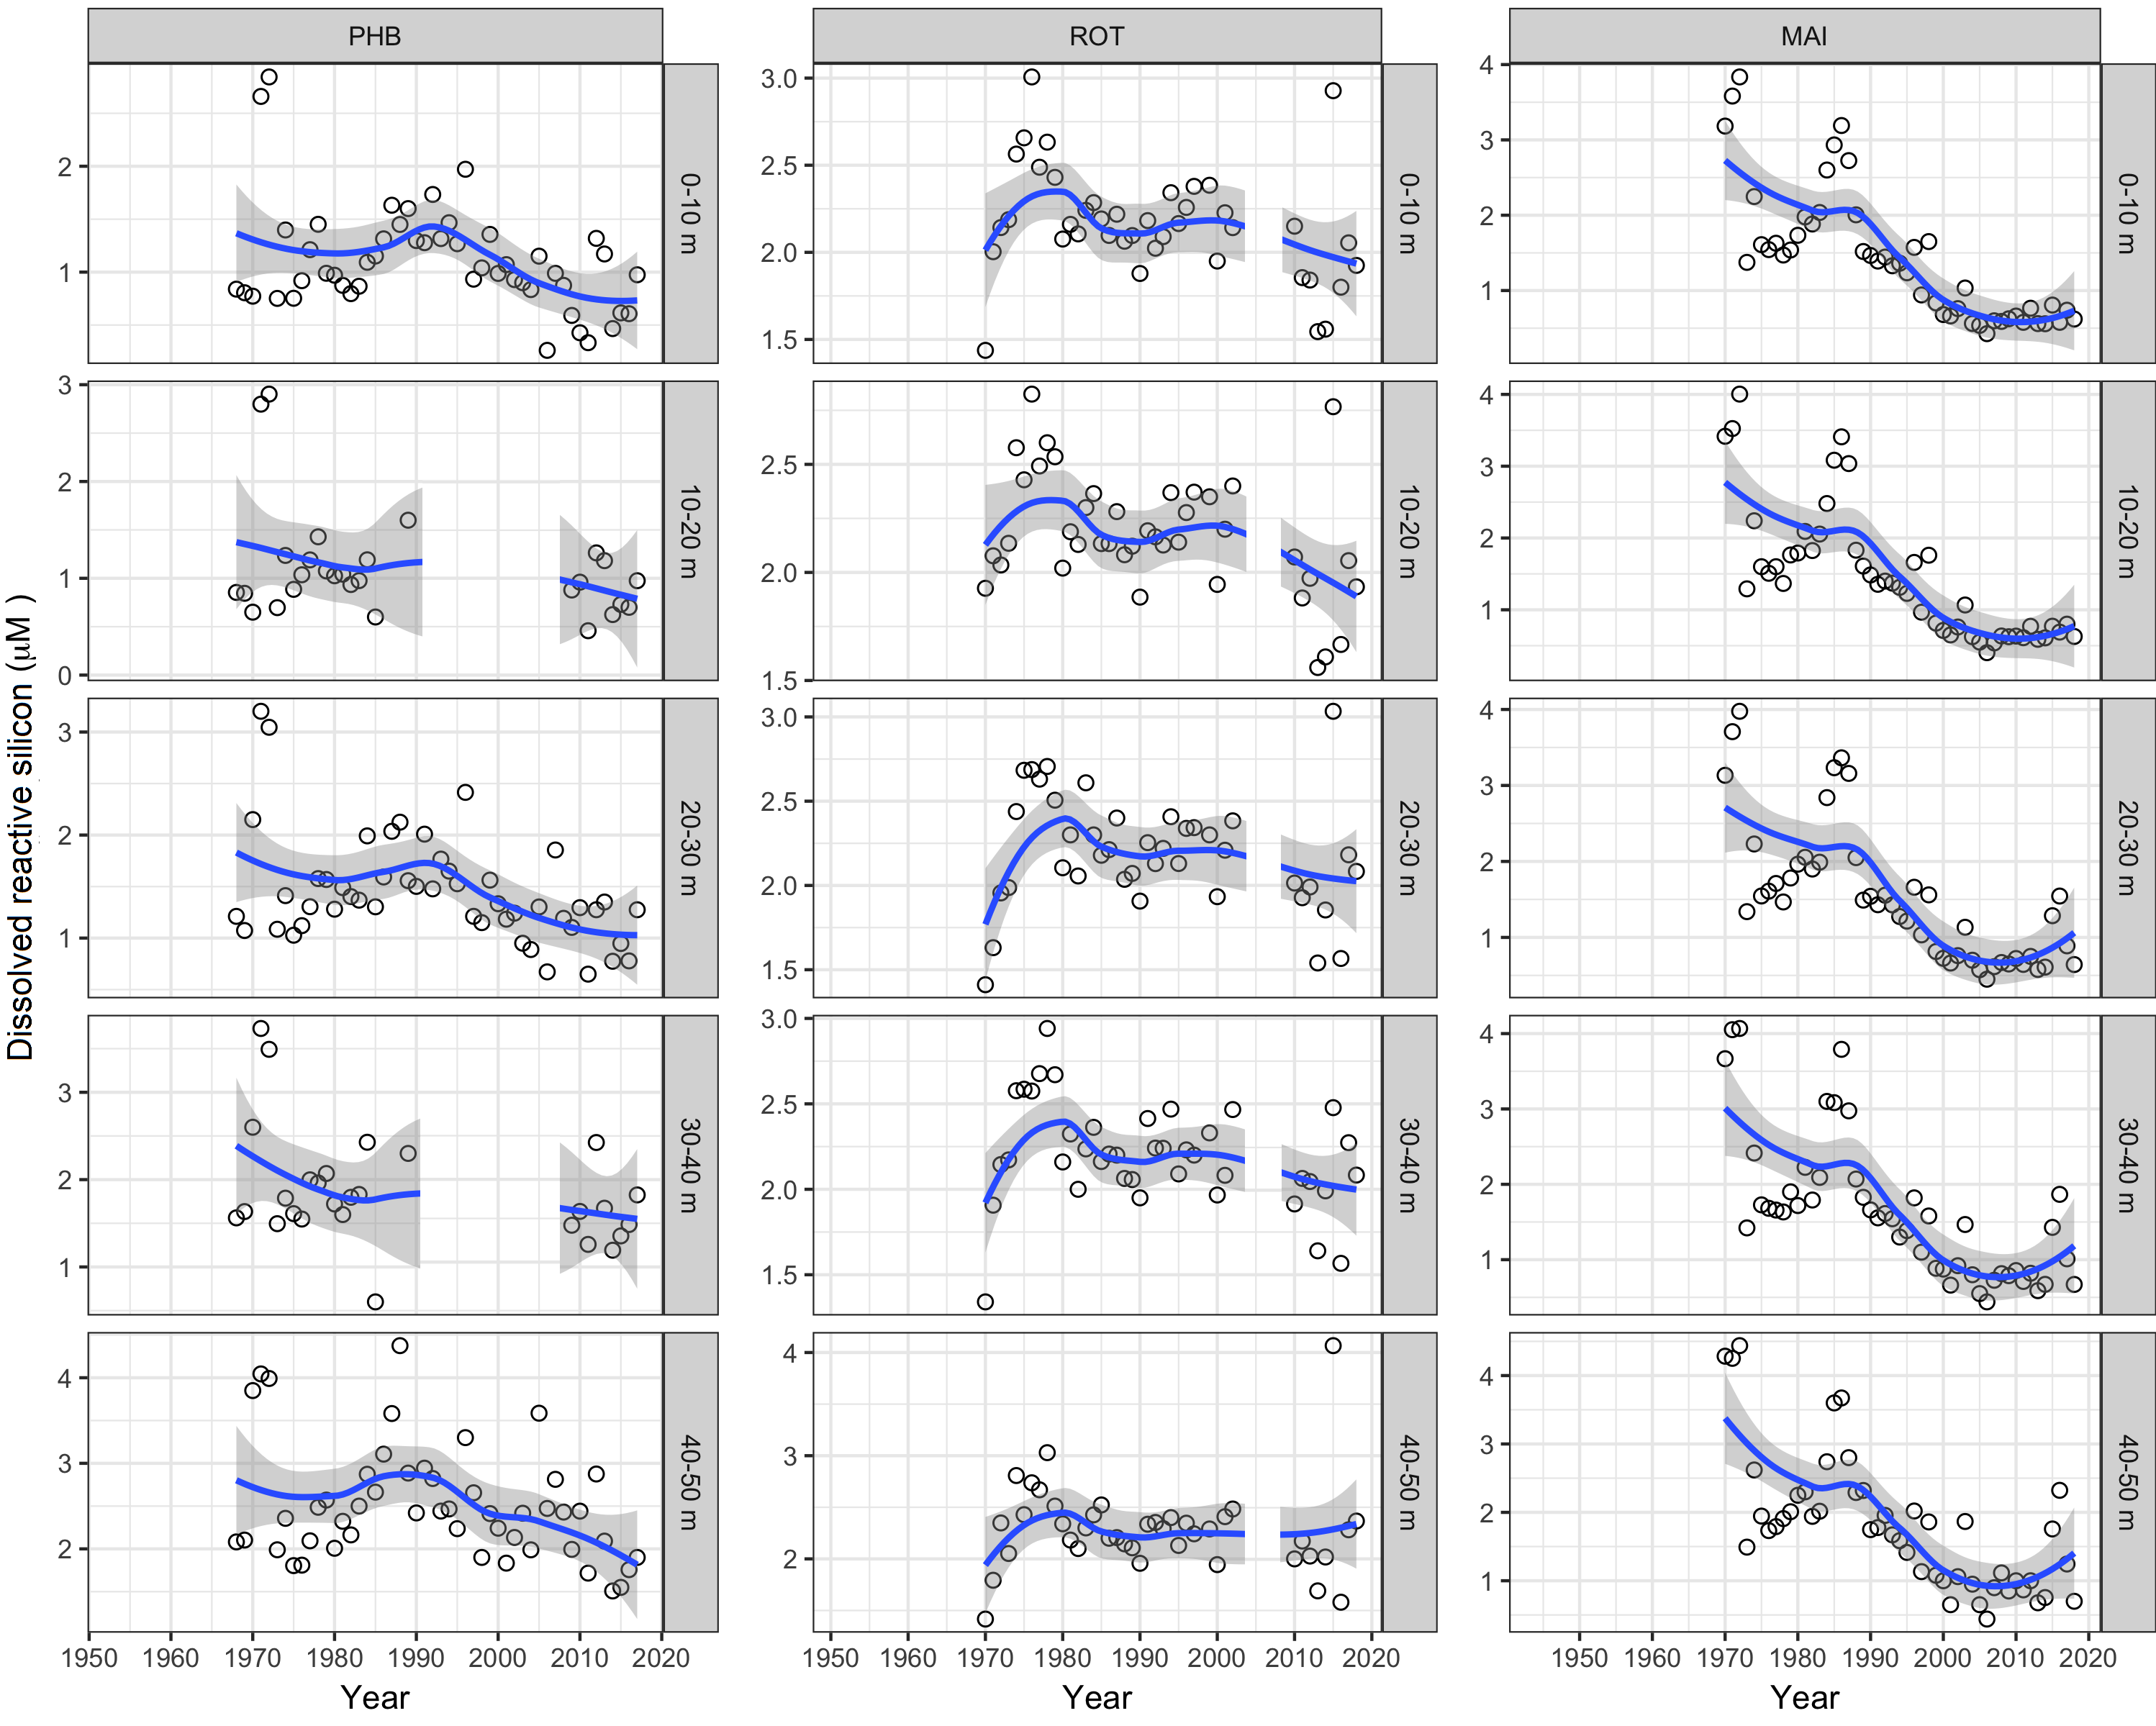
DSi has a shorter record than NO3– and DRP (1970 until now), although relatively unbroken (Figure 6). Its concentration has declined at all three long-term stations, most markedly at Maria Island, declining at the surface from >3 µM in 1970 to 1 µM now (unlike for NO3–, sub-Antarctic waters are depleted in DSi). Port Hacking appears to have declined over the same period from concentrations generally >1 µM to levels > 1 µM now. Apart from an initial anomaly, Rottnest Island has also declined from ~2.5 µM in surface waters to ~2 µM, which could be a consequence of reduced LC flow. Declines in DSi could also plausibly be linked with a mix of other factors—e.g. changes in composition of the phytoplankton community (viz. diatoms have become more active), decrease in supply to coastal waters from terrestrial runoff, and decline in remineralisation rates of biogenic silica.
Human activity influences both the concentration and the relative forms of inorganic and organic nutrients in marine systems directly (e.g. inflow of fertilisers and wastewaters) or indirectly through changes in global climate influencing oceanography, flowing through to primary producers at the base of marine food webs. IMOS NRS data suggest it is mostly meso-scale oceanography that is controlling the patterns in offshore coastal waters around Australia. Time series of annual mean concentrations at long-term stations depict shifts in N, P and Si; they are not in unison one with the other, nor between locations. Nutrient concentrations and proportions of N, P and Si control fertility, the balance of the planktonic and benthic primary producers, and ultimately the composition of marine food webs. Whether changes in nutrient distributions in coastal waters are already causing changes in these food webs, or the nutrients reflect changes caused by other factors (e.g. temperature, stratification) is not clear. For instance, in surface seawaters of Maria Island, increasing NO3– and decreasing DSi could favour a shift in phytoplankton from diatoms to dinoflagellates, or it could ensue from DSi removed from seawater by increasing proportions of diatoms stimulated by greater NO3– supplies. The former scenario is preferred by Thompson et al. (2009), albeit with DSi in subtropical waters removed upstream by diatoms. We therefore recommend that a future assessment of the impact of these changes should focus on close integration of the poorly constrained biogeochemical processes with changes in plankton and other primary producer communities, and the repercussions for higher-order consumers.
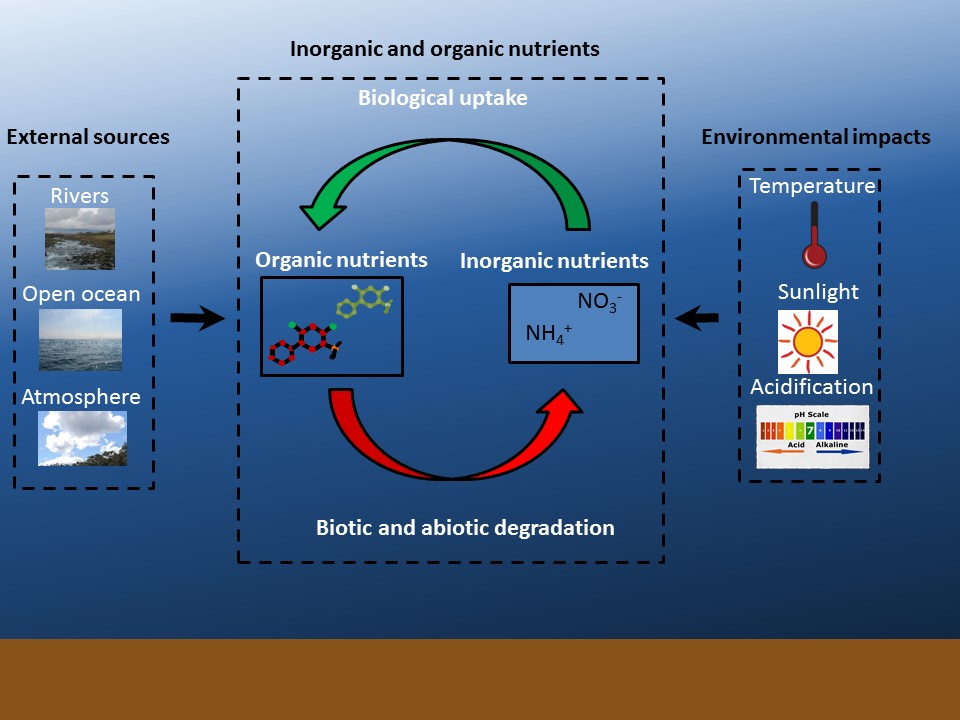
In marine systems, nitrogen and phosphorus are found in both inorganic and organic forms. Inorganic nutrients are non-living and are present in relatively few chemical forms, with dissolved inorganic N (DIN) found as ammonium (NH4+), nitrate (NO3–) and nitrite (NO2–), with NO3– being the most stable and dominant form (Wada & Hattori, 1991). Inorganic P is mostly found as orthophosphate (HPO42–; (Cembella, Antia, Harrison, & Rhee, 1984). Dissolved reactive Si exists overwhelmingly as orthosilicate (Si(OH)4 or Si(OH)3O– (Isshiki, Sohrin, & Nakayama, 1991).
By contrast, organic nutrients are contained in a complex mix of molecules from simple amino acids to highly complex chemical compounds. While inorganic nutrients and a small part of organic nutrients can be directly used for biological growth, most organic nutrients must first be degraded (either biologically by enzymes or abiotically by sunlight) to smaller compounds or inorganic nutrients before they can be used by marine life. These differences in processing steps impact how fast compounds are cycled in the environment. Generally inorganic nutrients are used at short timescales (hours to days), while the organic nutrients are used over a broader range of timescales (hours to years).
Few studies have accounted for the relative importance of both inorganic and organic nutrients. In oligotrophic tropical coastal waters of the Great Barrier Reef where inorganic nutrient levels are low, Lønborg et al. (2018) found that 95% of the nitrogen and 75% of the phosphorus used by marine life were in the organic fraction. This suggests that to understand and manage nutrients in coastal waters, it is important that future work measure and account for both inorganic and organic fractions (Figure B 1).
The availability of N, P and Si is not the only nutritional requirement of marine primary producers. Trace elements, especially transition metals of the first row in the Periodic Table, influence productivity at the base of marine ecosystems. These trace elements are characterised as micronutrients. Iron (Fe) is universally recognised as the most critical, and can be limiting by itself or limiting jointly with a macronutrient such as N) (Tagliabue et al., 2017) . Apart from Fe, micronutrients rarely, if ever, limit primary production (Moore et al., 2013) . More commonly, micronutrients (copper, zinc, cobalt, nickel, manganese, cadmium, selenium, etc.) influence pelagic primary productivity by favouring certain phytoplankton classes, which in turn impact the composition of higher trophic levels.
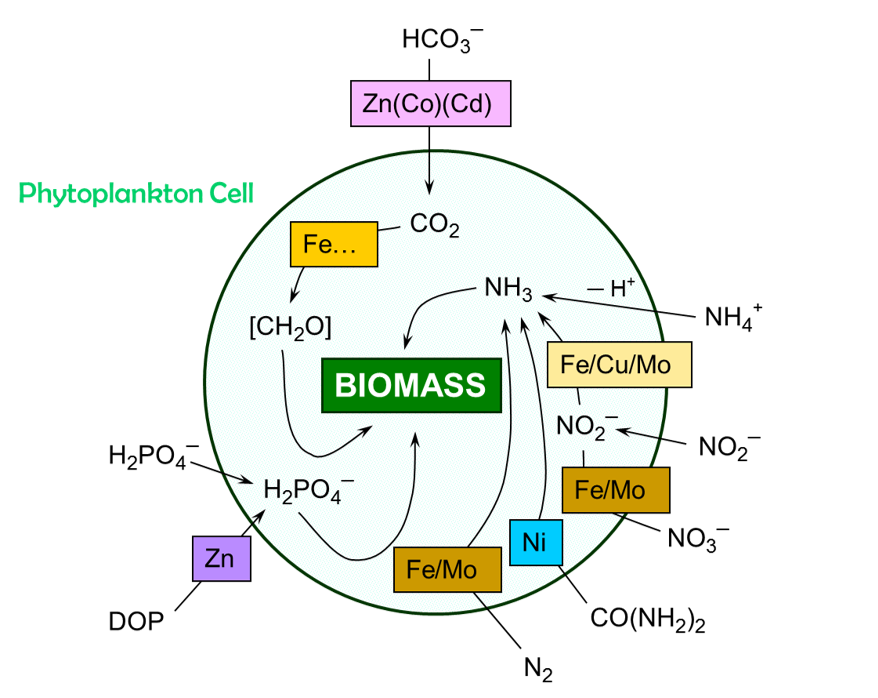
The influence of micronutrients is manifest among the different classes of phytoplankton, right down to their cellular physiology (Figure B 2, Morel and Price (2003)). Fe is the micronutrient in most demand because it is pivotal in photosynthesis (as a metal centre in photosystems (PSI and PSII) and ferredoxin), an integral component of cytochromes, and specific cellular processes involving the handling of N (e.g. N2 fixation, nitrate/nitrite reduction). Other micronutrients play more specific roles. Zinc mediates two critical pathways as a metal centre for the enzymes carbonic anhydrase and alkaline phosphatase. Copper is active as a cofactor in photosynthesis and nitrogen cycling (e.g. denitrification, ammonium oxidation). Some micronutrients have a specific role: cobalt is the metal cofactor in Vitamin B12, an important agent for biomethylation; whereas nickel is the metal centre in the enzyme urease, responsible for the decomposition of urea to ammonia and CO2.
The requirement by phytoplankton for micronutrients is adaptable to prevailing conditions. For example, Zn can be replaced by Co or Cd in carbonic anhydrase (Morel & Price, 2003). The substitution may distinguish different phytoplankton taxa, or it may be a strategy to retain functionality during severe deficiency of the favoured metal at the expense of decreased efficiency. Other physiological strategies involve the substitution by a main-group metal (e.g. alkaline phosphatase variant, with Ca replacing Zn – (Sebastian & Ammerman, 2009) or the avoidance of a metal centre altogether (e.g. flavodoxin for ferredoxin – (Roche, Murray, Orellana, & Newton, 1995).
Extracellular processes can also favour the acquisition of micronutrients through the excretion of organic compounds (ligands) to sequester essential metals. These ligands (e.g. siderophores) are exuded by some micro-organisms, which have mechanisms to transport the bound metals intracellularly (Vraspir & Butler, 2009).
Canfield, D. E., Glazer, A. N., & Falkowski, P. G. (2010). The evolution and future of Earth's nitrogen cycle. Science 330, 192–196.
Cembella, A. D., Antia, N. J., Harrison, P. J., & Rhee, G. Y. (1984). The utilization of inorganic and organic phosphorous compounds as nutrients by eukaryotic microalgae: A multidisciplinary perspective: Part 2. CRC Critical Reviews in Microbiology, 11(1), 13-81. doi:10.3109/10408418409105902
Harris, G., Nilsson, C., Clementson, L., & Thomas, D. (1987). The water masses of the east coast of Tasmania: seasonal and interannual variability and the influence on phytoplankton biomass and productivity. Australian Journal of Marine and Freshwater Research, 38, 569-590.
Hayes, D., Lyne, V., Condie, S. A., Griffiths, B., Pigot, S., & Hallegraeff, G. (2005). Collation and analysis of oceanographic datasets for National marine bioregionalisation. Retrieved from
Isshiki, K., Sohrin, Y., & Nakayama, E. (1991). Form of dissolved silicon in seawater. Marine Chemistry, 32(1), 1-8. doi: 10.1016/0304-4203(91)90021-N
Kitadai, N., & Maruyama, S. (2018). Origins of building blocks of life: A review. Geoscience Frontiers, 9(4), 1117-1153. doi: 10.1016/j.gsf.2017.07.007
Lønborg, C., Álvarez–Salgado, X. A., Duggan, S., & Carreira, C. (2018). Organic matter bioavailability in tropical coastal waters: The Great Barrier Reef. Limnology and Oceanography, 63(2), 1015-1035. doi:10.1002/lno.10717
Lynch, T. P., Morello, E. B., Evans, K., Richardson, A. J., Rochester, W., Steinberg, C., . . . Moltman, T. (2014). IMOS National Reference Stations: a continental-wide physical, chemical and biological coastal observing system. PLoS ONE, 9(12), e113652.
Moore, C. M., Mills, M. M., Arrigo, K. R., Berman-Frank, I., Bopp, L., Boyd, P. W., . . . Ulloa, O. (2013). Processes and patterns of oceanic nutrient limitation. Nature Geoscience, 6, 701. doi:10.1038/ngeo1765
Morel, F. M. M., & Price, N. M. (2003). The biogeochemical cycles of trace metals in the oceans. Science, 300(5621), 944. doi:10.1126/science.1083545
Radke, L., Nicholas, T., Thompson, P. A., Li, J., Raes, E., Carey, M., . . . Nichol, S. (2017). Baseline biogeochemical data from Australia’s continental margin links seabed sediments to water column characteristics. Marine and Freshwater Research, 68(9), 1593-1617. doi: 10.1071/MF16219
Rees, C., Pender, L., Sherrin, K., Schwanger, C., Hughes, P., Tibben, S., . . . Rayner, M. (2019). Methods for reproducible shipboard SFA nutrient measurement using RMNS and automated data processing. Limnology and Oceanography: Methods, 17(1), 25-41. doi:10.1002/lom3.10294
Roche, J. L., Murray, H., Orellana, M., & Newton, J. (1995). Flavodoxin expression as an indicator of iron limitation in marine diatoms. Journal of Phycology, 31(4), 520-530. doi:10.1111/j.1529-8817.1995.tb02545.x
Ruttenberg, K. C. (2014). 10.13 - The Global Phosphorus Cycle. In H. D. Holland & K. K. Turekian (Eds.), Treatise on Geochemistry (Second Edition) (pp. 499-558). Oxford: Elsevier.
Sebastian, M., & Ammerman, J. W. (2009). The alkaline phosphatase PhoX is more widely distributed in marine bacteria than the classical PhoA. The ISME Journal, 3(5), 563-572. doi:10.1038/ismej.2009.10
Tagliabue, A., Bowie, A. R., Boyd, P. W., Buck, K. N., Johnson, K. S., & Saito, M. A. (2017). The integral role of iron in ocean biogeochemistry. Nature, 543, 51-59. doi:10.1038/nature21058
Thompson, P., Baird, M., Ingleton, T., & Doblin, M. A. (2009). Long-term changes in temperate Australian coastal waters: implications for phytoplankton. Marine ecology progress series, 394, 1-19.
Thompson, P. A., Bonham, P., Waite, A. M., Clementson, L. A., Cherukuru, N., Hassler, C., & Doblin, M. A. (2011). Contrasting oceanographic conditions and phytoplankton communities on the east and west coasts of Australia. Deep Sea Research Part II: Topical Studies in Oceanography, 58(5), 645-663. doi: 0.1016/j.dsr2.2010.10.003
Tréguer, P. J., & Rocha, C. L. D. L. (2013). The world ocean silica cycle. Annual Review of Marine Science, 5(1), 477-501. doi:10.1146/annurev-marine-121211-172346
van Ruth, P. D., Patten, N. L., Doubell, M. J., Chapman, P., Rodriguez, A. R., & Middleton, J. F. (2018). Seasonal- and event-scale variations in upwelling, enrichment and primary productivity in the eastern Great Australian Bight. Deep Sea Research Part II: Topical Studies in Oceanography, 157-158, 36-45. doi: 10.1016/j.dsr2.2018.09.008
Vraspir, J. M., & Butler, A. (2009). Chemistry of marine ligands and siderophores. Annual Review of Marine Science, 1(1), 43-63. doi:10.1146/annurev.marine.010908.163712
Wada, E., & Hattori, A. (1991). Nitrogen in the Sea: forms, abundances, and rate processes. Boca Raton, Florida: CRC Press.
Figure 1
Time series of dissolved reactive phosphorus (DRP) in different depth layers at the 7 IMOS National Reference Stations. Dots represent observed data and the trends are represented by blue lines with grey shaded areas defining 95% confidence intervals of those trends.
Figure 2
Time series of dissolved reactive silicon (DSi) in different depth layers at the 7 IMOS National Reference Stations. Dots represent observed data and the trends are represented by blue lines with grey shaded areas defining 95% confidence intervals of those trends.
Figure 3
Time series of nitrate (NO3-) in different depth layers at the 7 IMOS National Reference Stations. Dots represent observed data and the trends are represented by blue lines with grey shaded areas defining 95% confidence intervals of those trends.
Figure 4
Annual time series of nitrate (NO3-) in different depth layers at the three long-term, Australian coastal stations—Port Hacking (100-m station; PHB), Rottnest Island (ROT) and Maria Island (MAI). Dots represent observed data and the trends are represented by blue lines with grey shaded areas defining 95% confidence intervals of those trends. Note data gaps in some time series.
Figure 5
Annual time series of dissolved reactive phosphorus (DRP) in different depth layers at the three long-term, Australian coastal stations—Port Hacking (100-m station; PHB), Rottnest Island (ROT) and Maria Island (MAI). Dots represent observed data and the trends are represented by blue lines with grey shaded areas defining 95% confidence intervals of those trends. Note data gaps in some time series.
Figure 6
Annual time series of dissolved reactive silicon (DSi) in different depth layers at the three long-term, Australian coastal stations—Port Hacking (100-m station; PHB), Rottnest Island (ROT) and Maria Island (MAI). Dots represent observed data and the trends are represented by blue lines with grey shaded areas defining 95% confidence intervals of those trends. Note data gaps in some time series.
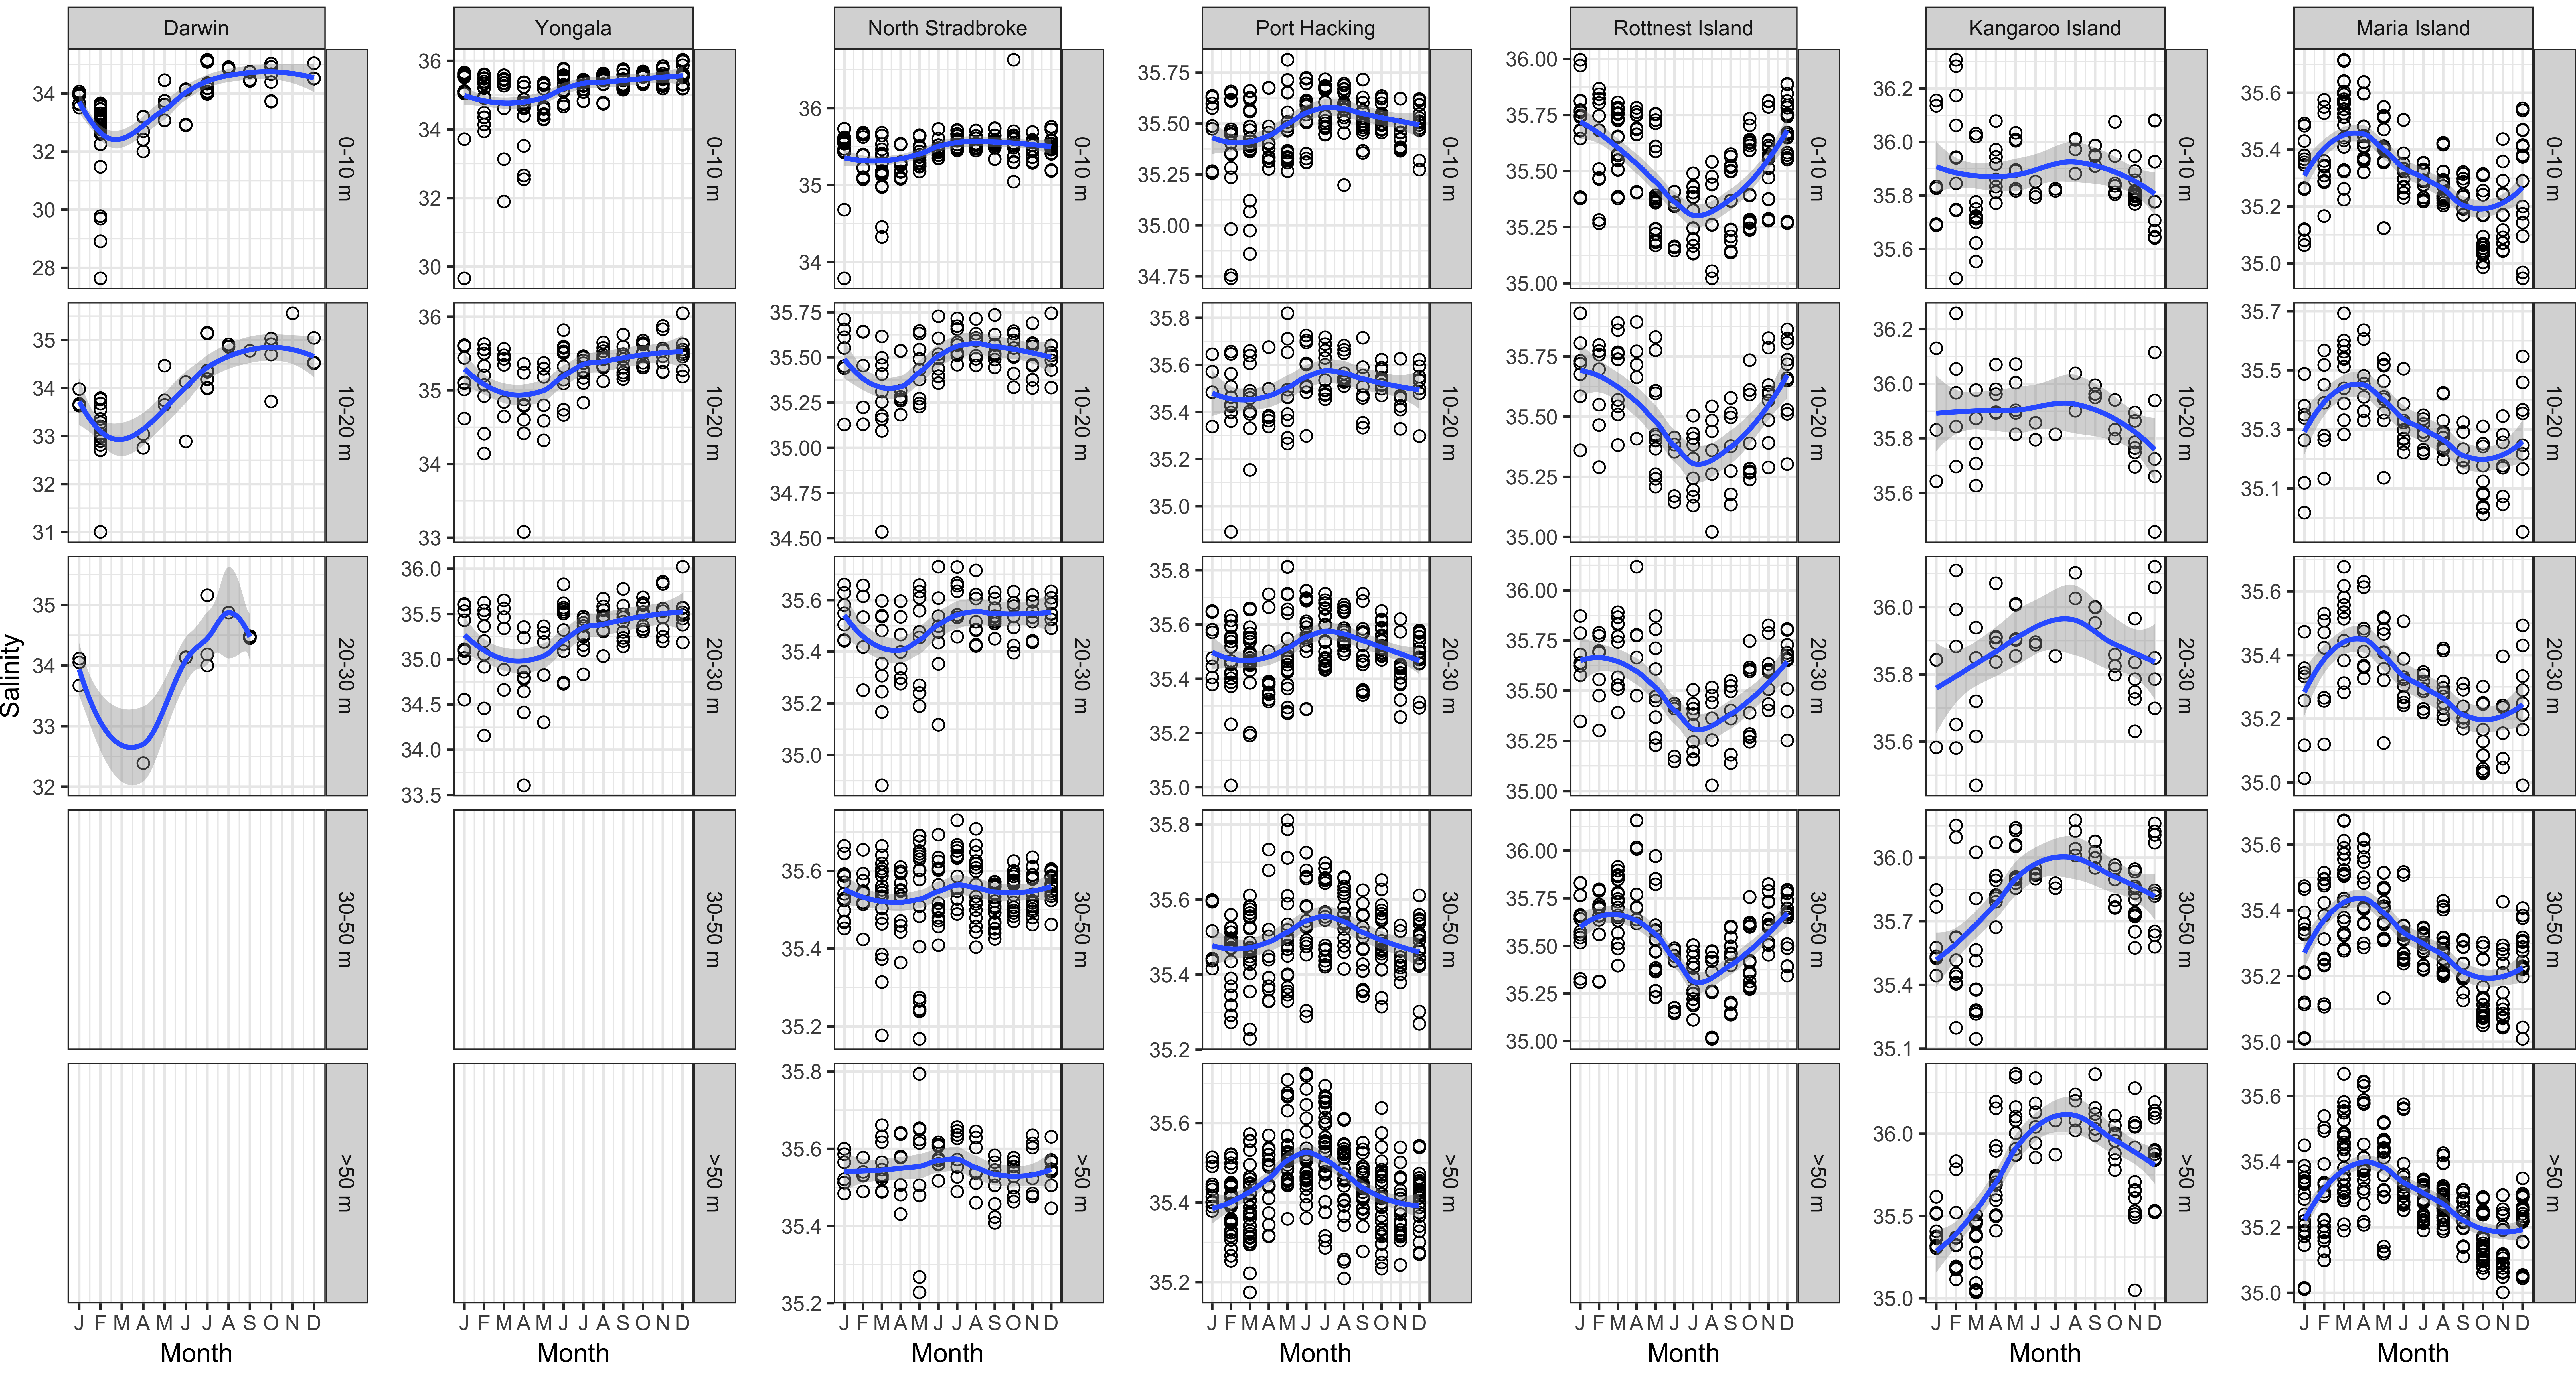
Figure S1
Seasonal cycle of salinity levels in different depth layers at the 7 IMOS National Reference Stations. Dots represent observed data and the trends are represented by blue lines with grey shaded areas defining 95% confidence intervals of those trends.
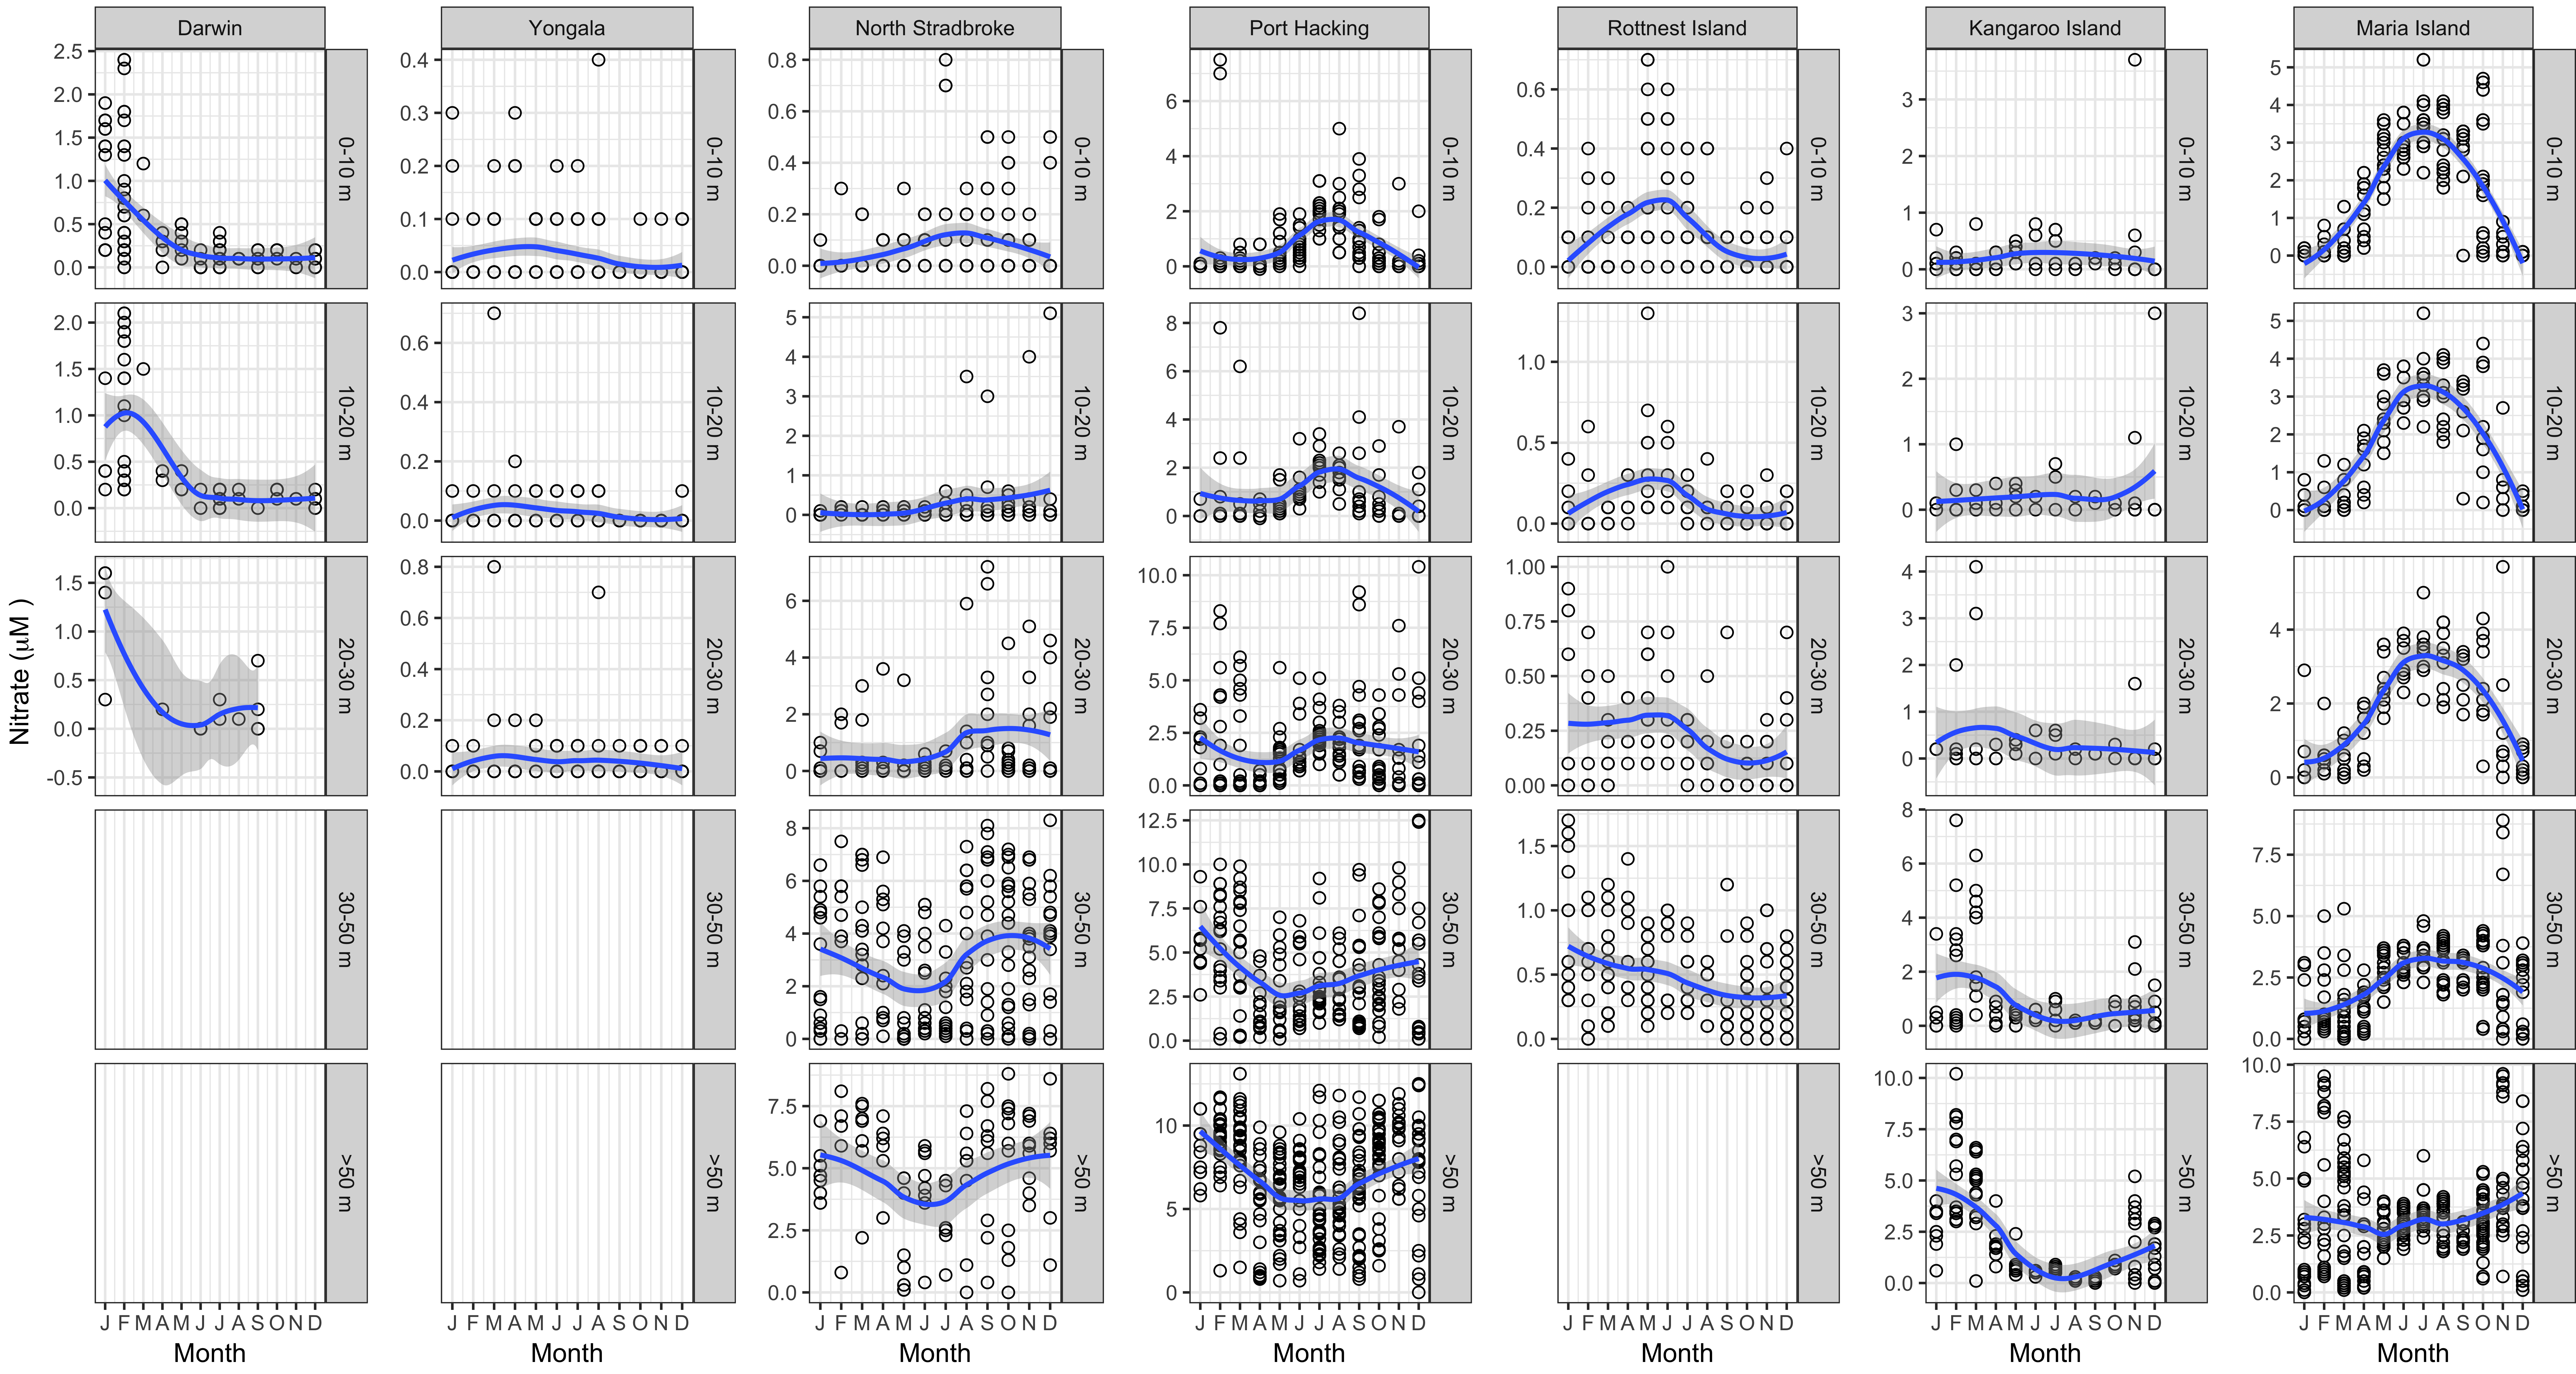
Figure S2
Seasonal cycle of nitrate (NO3-) in different depth layers at the 7 IMOS National Reference Stations. Dots represent observed data and the trends are represented by blue lines with grey shaded areas defining 95% confidence intervals of those trends. Time-span of observations presented varies for each NRS, see Overall Methods.
Figure S3
Seasonal cycle of dissolved reactive phosphorus (DRP) in different depth layers at the 7 IMOS National Reference Stations. Dots represent observed data and the trends are represented by blue lines with blue shaded areas defining 95% confidence intervals of those trends. Time-span of observations presented varies for each NRS, see Overall Methods.
Figure S4
Seasonal cycle of dissolved reactive silicate (DSi) in different depth layers at the IMOS National Reference Stations. Dots represent observed data and the trends are represented by blue lines with blue shaded areas defining 95% confidence intervals of those trends. Time-span of observations presented varies for each NRS, see Overall Methods.
Figure B1
Schematic overview showing the 1) main external sources, 2) interplay between inorganic and organic nutrients, and 3) some of the main environmental factors impacting this interplay.
Figure B2
Micronutrients in key carbon, nitrogen and phosphorus pathways. An ellipsis (e.g. Fe...) indicates other metals of lesser prominence are also cofactors in the pathway. Metals in parenthesis (e.g. (Co)) denote less preferred or less efficient cofactors. A forward slash separates metals active in different steps in a pathway, operating in combination, or having a different function as a cofactor. Modified from original in Morel & Price 2003.
Download this Time Series Report
Citing this report:
Butler E, Skuza M, Lønborg C. (2020) Spatial and temporal trends in concentrations of the nutrients N, P, Si. In Richardson A.J, Eriksen R, Moltmann T, Hodgson-Johnston I, Wallis J.R. (Eds). State and Trends of Australia’s Ocean Report. doi: 10.26198/5e16a2ff49e77
doi: 10.26198/5e16a2ff49e77
Citing the Report
Richardson A.J, Eriksen R, Moltmann T, Hodgson-Johnston I, Wallis J.R. (2020). State and Trends of Australia’s Ocean Report, Integrated Marine Observing System (IMOS).

The State and Trends of Australia's Ocean Report was supported by IMOS. IMOS gratefully acknowledges the additional support provided by the Commonwealth Scientific and Industrial Research Organisation (CSIRO).
The State and Trends of Australia's Ocean website is maintained by IMOS.

Australia’s Integrated Marine Observing System (IMOS) is enabled by the National Collaborative Research Infrastructure Strategy (NCRIS). It is operated by a consortium of institutions as an unincorporated joint venture, with the University of Tasmania as Lead Agent.
Disclaimer:
You accept all risks and responsibility for losses, damages, costs and other consequences resulting directly or indirectly from using this site and any information or material available from it. While the Integrated Marine Observing System (IMOS) has taken reasonable steps to ensure that the information on this website and related publication is correct, it provides no warranty or guarantee that information provided by the authors is accurate, complete or up-to-date. IMOS does not accept any responsibility or liability for any actions taken as a result of, or in reliance on, information on its website or publication. Users should check with the originating authors to confirm the accuracy of the information before taking any action in reliance on that information.
If you believe any information on this website or in the related publication is inaccurate, out of date or misleading, please bring it to our attention by contacting the authors directly or emailing us at IMOS@imos.org.au
Images and Information:
All information on this website remains the property of those who authored it. All images on this website are licensed through Adobe Stock, Shutterstock, or have permission from the original owner.
